
BACKGROUND AND AIMS
Multiple sclerosis (MS) is a chronic, inflammatory, and neurodegenerative disease of the central nervous system, characterised by non-uniform clinical manifestations. Resting state (RS) functional MRI (fMRI) studies of patients with MS often showed trends towards higher functional connectivity (FC) at the earliest disease stages, followed by a gradual RS FC reduction in progressive MS (PMS).1,2 However, complex patterns of regional increased and decreased RS FC in critical brain networks have been described across MS phenotypes. Moreover, RS FC abnormalities do not have a straightforward relationship with the severity of clinical and cognitive symptoms.1,2 Network-based methods on RS fMRI data are helping to shed light into brain functional reorganisation in MS3,4 and, combined with machine-learning, may produce important clues to support automated classification of patients with MS. Against this background, the aim of this study was to develop advanced machine-learning methods to analyse RS FC data and classify patients with MS according to their disease phenotype.
MATERIALS AND METHODS
RS fMRI scans were obtained from 46 right-handed healthy controls (HC) and 113 MS patients (62 relapsing-remitting MS [RRMS] and 51 PMS).
After RS fMRI pre-processing, RS FC matrices were created by means of pair-wise covariance between RS fMRI time series extracted from the automatic anatomical labelling atlas. RS FC matrices were then clustered into groups with dominant-set clustering exploiting the geodesic metric. Each cluster represents a group of subjects with some similarity in their FC. A reference connectome (geodesic mean) was determined for each cluster, and each RS FC matrix was then represented by a set of geodesic distances from cluster representatives. This representation was used to classify subjects (HC, RRMS, and PMS) using a linear support vector machine, executed 100 times with a 5-fold cross-validation scheme. Finally, a sensitivity analysis on the trained classifier was used to identify clusters and connections more relevant for classification.
RESULTS
The described machine-learning tool was able to classify patients with RRMS from HCs with an accuracy of 72.5%, patients with PMS from HCs with an accuracy of 85.2%, and patients with PMS from patients with RRMS with an accuracy of 76.0% (Figure 1). The sensitivity analysis on trained support vector machines found that increased RS FC in the basal ganglia subnetwork (peculiarly involving the bilateral thalami) and abnormal RS FC in the frontal subnetwork contributed to an accurate classification of both patients with RRMS and PMS from HCs (Figure 1). Moreover, decreased RS FC in occipito-temporal subnetworks contributed to differentiate patients with RRMS from HCs, while decreased RS FC in the parietal sub-network (especially involving the precunei and posterior cingulate cortices) contributed to differentiate patients with PMS from patients with RRMS.
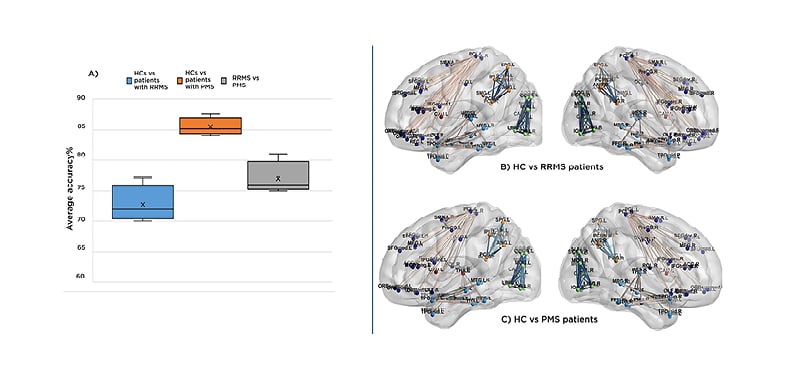
Figure 1: Results from machine-learning tool to classify patients with relapsing-remitting multiple sclerosis and progressive multiple sclerosis from healthy controls.
A) Boxplot representing the average cross-fold validation accuracy for the following classification tasks: HCs versus RRMS (blue), HCs versus PMS (orange), and patients with RRMS versus patients with PMS (grey). B,C) Illustrative example of RS FC differences within the main sub-networks of the brain (parcellated according to cortical lobe) contributing to the classification task: B) RS FC differences between HCs and patients with RRMS. C) RS FC differences between HCs and patients with PMS. RS FC decrease in patients versus HCs is colour-coded in blue, while RS FC increase is colour-coded in orange-red.
FC: functional connectivity; HC: healthy control; PMS: progressing multiple sclerosis; RRMS: relapsing-remitting multiple sclerosis; RS: resting state; vs: versus.
CONCLUSION
A combination of different machine-learning principles allowed to classify patients with MS with different clinical phenotypes from HCs with a good accuracy. Increased RS FC in the basal ganglia sub-network contributed to an accurate classification of both patients with RRMS and PMS from HCs, suggesting that altered thalamic and frontal RS FC may be a hallmark of MS disease, occurring in all MS phenotypes. Conversely, the peculiar involvement of occipito-temporal subnetworks in patients with RRMS might be secondary to damage of associative sensory regions, while the peculiar involvement of the posterior cingulate cortex and precuneus in PMS suggests a spreading of damage to high-order, associative regions, leading to impaired network integration.