BACKGROUND AND AIMS
Contrast-enhanced spectral mammography (CESM) is an emerging diagnostic imaging technique with a high breast cancer detection rate but limited diagnostic specificity.1 Published studies have proven that CESM has similar accuracy to MRI for the detection of breast cancer, and can also give information about lesion vascularity and dynamics.1,2 Therefore, quantification of lesion enhancement intensity and pattern might be helpful in increasing specificity and predicting tumour histology.1-3 In this study, the authors aimed to quantify the enhancement intensity and pattern of different breast lesions seen in CESM, and to investigate the correlation with enhancement types in breast MRI.
MATERIALS AND METHODS
Using CESM studies from the CONTEND4 and BRAID5 trials, three experienced breast radiologists calculated contrast-to-noise ratio (CNR) for each lesion identified in the temporally earlier (craniocaudal view; CNR1) and later (mediolateral oblique view; CNR2), where CNR=Sa-Sb/Sb (Sa: maximum pixel value in breast lesion; Sb: mean pixel value of background). Relative signal difference (RSD) was calculated as CNR2-CNR1/CNR1x100%. Enhancement patterns in CESM were classified as no enhancement, progressive (RSD>10%), plateau (-10%≤RSD≤10%), or washout (RSD<-10%). Similarly, MRI enhancement patterns were recorded for 38 lesions that had a clinical breast MRI at the same episode. The statistical analysis was conducted using Stata 17.0 (StataCorp LLC, College Station, Texas, USA). To compare groups, a Mann–Whitney U test was used for two independent groups, and a Kruskal–Wallis test for more than two independent groups. A p value <0.05 was deemed significant. Receiver operating characteristics curve and area under the curve were generated to assess the diagnostic performances. The study population consisted of 256 CESM research studies, from which 98 lesions were identified. Twenty-eight lesions were excluded due to suboptimal image quality or lesion seen on only one view.
RESULTS
Histopathology of 70 lesions (3–110 mm) was 49 cancers (42 invasive, 7 non-invasive) and 21 normal/benign (seven B1, 12 B2, and two B3). The authors grouped the lesions according to their submolecular types and hormone receptor status. The CNR1 values were significantly lower for benign lesions than for invasive cancers (mean CNR1: 0.046 versus 0.066; p<0.0095), but not significantly different for the non-invasive group (mean CNR1: 0.046 versus 0.058; p<0.07) (Figure 1A). Also, benign lesions had higher RSD values compared with malignant ones (mean RSD: 29.89 versus -8.48; p<0.0001) (Figure 1B). The diagnostic performance of CNR1 was better compared with CNR2 and RSD, with an area under the receiver operating characteristic curve of 0.78 (Figure 1C). The authors did not find significant values for different molecular subtypes, but this was probably related to the low number of lesions in this study. Most of the benign lesions showed progressive enhancement in CESM, while the invasive cancers’ enhancement patterns were mainly washout and plateau (Figure 1D). Full agreement between CESM and MRI enhancement patterns was found in 29 of 38 cases (76.3%), with a Pearson chi-square value χ2=54.5 and a Cramér’s V φc=0.69, showing good correlation between the two techniques.
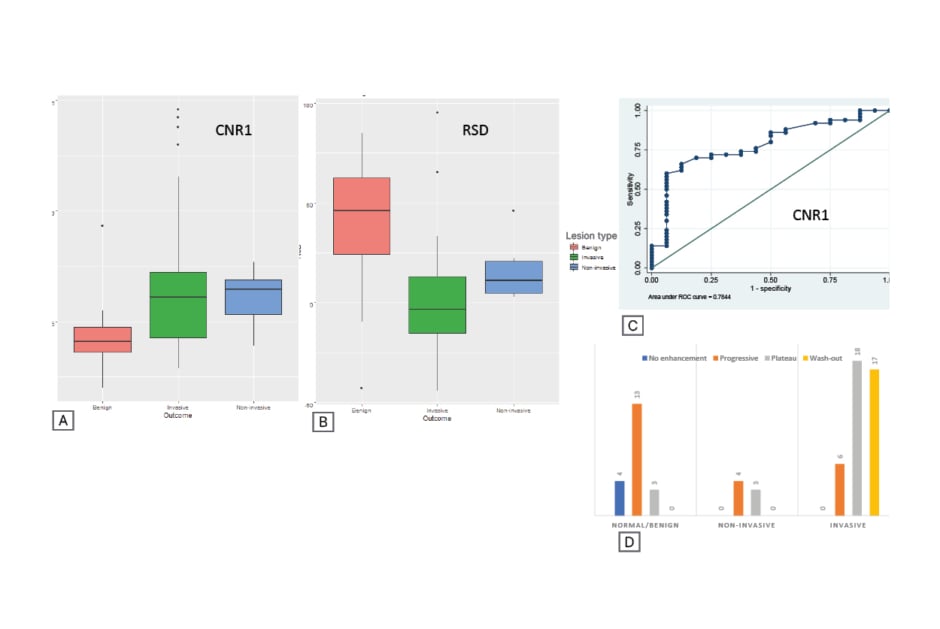
Figure 1: Diagnostic performance of CNR1 compared with RSD and enhancement patterns for benign and malignant lesions on CESM.
A) CNR1 and B) RSD values for benign, invasive, and non-invasive tumoral lesions. C) Diagnostic performance for CNR1. D) Distribution of enhancement patterns in CESM.
CESM: contrast-enhanced spectral mammography; CNR: contrast to noise ratio; ROC: receiver operating characteristics; RSD: relative signal difference.
CONCLUSION
These preliminary results indicate that quantification of enhancement intensity in CESM may be helpful to differentiate between benign and malignant breast lesions. Furthermore, there seems to be good correlation between MRI and CESM enhancement patterns. This study was limited by the small number of pathologies. Next steps should include a larger, more heterogeneous study population; further analysis according to molecular subtypes; and possible integration of radiomic features to predict tumor histology and prognosis.