Abstract
Interstitial lung disease (ILD) represents a heterogeneous group of disorders characterised by inflammation and fibrosis of lung tissues, often linked to significant morbidity and mortality. Increasing incidence of ILD in the USA, coupled with the known impact of air pollution on respiratory diseases, necessitates exploration of the potential relationship between environmental exposures and ILD.
This study examines the correlation between air pollution, specifically particulate matter with a diameter of 2.5 µm or less (PM2.5), nitrogen dioxide, and ozone, and ILD incidence across the USA from 1990–2021, utilising data from the Global Burden of Disease (GBD) database.
The authors performed a retrospective analysis using GBD data, correlating age-standardised ILD incidence rates with state-level pollution exposure metrics for PM2.5, nitrogen dioxide, and ozone. Pollution was measured using Summary Exposure Values (SEV). SEV is a population-weighted exposure metric that reflects both pollutant levels and related health risk. Because PM2.5-specific concentration data were not consistently available for all study years, SEV for ambient particulate matter was used as a proxy. Temporal trends in both variables were assessed, and scatter plots were employed to evaluate statistical associations. Geographic disparities in pollution and disease incidence were visualised with heat maps.
From 1990–2021, ILD incidence increased across all states, despite declining pollution levels. A moderate positive correlation (r=0.51) was identified between pollution exposure and ILD incidence, with higher disease rates observed in states like California and Texas, USA, which have elevated pollution levels. However, in population-weighted regression models, the association between particulate matter exposure and ILD incidence was not statistically significant.
At the state level, air pollution exposure was associated with ILD incidence, but findings from this ecological analysis do not establish causation. Further individual-level longitudinal studies are needed to clarify whether air pollution may contribute to ILD development or progression.
Key Points
1. Interstitial lung disease (ILD) incidence is increasing in the USA, despite declining national pollution levels, highlighting concerns about cumulative environmental exposure and long-term respiratory effects.2. This state-level ecological analysis used Global Burden of Disease (1990–2021) data to examine associations between age-standardised ILD incidence and population-weighted exposure to particulate matter, nitrogen dioxide, and ozone.
3. Air pollution exposure correlated with ILD incidence at the population level, though causality cannot be established; environmental factors should be considered in clinical assessment, alongside the need for individual-level longitudinal research.
INTRODUCTION
Interstitial lung disease (ILD) encompasses a diverse group of pulmonary disorders characterised by inflammation and fibrosis of the lung interstitium. These conditions can lead to significant morbidity and mortality, making understanding their aetiology essential for public health. Recent epidemiological studies have highlighted a rising incidence of ILD in the USA, prompting an investigation into potential risk factors contributing to this trend.1
Emerging evidence implicates air pollution as a significant factor in idiopathic pulmonary fibrosis (IPF) progression, with studies demonstrating that air pollution, particularly fine particulate matter with a diameter of 2.5 µm or less (PM2.5), nitrogen dioxide (NO₂), and ozone (O₃), can exacerbate pre-existing lung conditions and contribute to the development of new respiratory diseases, including ILD.2-6 Specifically, chronic exposure to PM2.5 and NO₂ has been associated with oxidative stress, inflammation, and fibrosis of lung tissues, which are key mechanisms in the development of ILD.2,3,5 In addition, air pollution exposure has been shown to exacerbate IPF, one of the most common forms of ILD, potentially accelerating its progression.3,5,6
Updated diagnostic guidelines underscore the importance of identifying environmental factors in patients with ILD, including smoking and occupational exposures.7 This retrospective study investigates the association between air pollution and ILD incidence across the USA, analysing data from national health registries and air quality systems. These findings will inform public health policies and strategies to mitigate the impact of environmental factors on lung health.
METHODS
This study is a secondary analysis of data from the Global Burden of Disease (GBD) 2021 study, produced by the Institute for Health Metrics and Evaluation (IHME). State-level age-standardised incidence rates of ILD were extracted for all 50 states in the USA for the period from 1990–2021. ILD incidence included pulmonary sarcoidosis and excluded pneumoconioses and other occupational lung diseases.
Air pollution exposure data were obtained from the GBD database and included Summary Exposure Values (SEV) for PM2.5, NO₂, and O₃. SEVs represent population-weighted exposure metrics that incorporate both pollutant concentration andassociated health risk. To assess spatial concordance, state-level particulate matter SEVs were compared with annual mean PM2.5 concentrations obtained from the USA Environmental Protection Agency (EPA) Air Quality System (AQS).8 EPA data were aggregated to state-level annual means. Strong agreement between datasets supported the use of GBD SEVs for comparative analyses.
Additional air pollution metrics were derived from EPA AQS regulatory monitoring data. These included annual mean PM2.5 concentrations (µg/m³), annual mean NO₂ concentrations (ppb), and warm-season average daily maximum 8-hour ozone concentrations (ppb). These measures were included to improve comparability with prior epidemiologic studies using regulatory air quality data.
Corresponding ICD-9-CM codes (516.xx and 135) were used for earlier years. Pneumoconioses and occupational lung diseases (J60–J65) were excluded to minimise the confounding effect of occupational exposure. Age-standardised incidence rates were calculated using the GBD global reference population. The authors acknowledge that ICD coding can introduce some misclassification error, particularly in distinguishing subtypes of ILD or separating occupational causes. However, given the large-scale, state-level focus of this study, ICD coding remains the most feasible and standardised method for case identification across multiple decades and regions. Age-standardised rates were based on the GBD global reference population.
Associations between ILD incidence and particulate matter exposure were evaluated using population-weighted linear regression models at the state–year level. Models were weighted by state–year incident counts and adjusted for sex composition and calendar year to account for temporal trends.
The datasets used consist of two primary sources: the Air Pollution Dataset and the ILD and Sarcoidosis Incidence Dataset, both containing detailed information spanning several years across all states in the USA. The Air Pollution Dataset includes data on various types of air pollutants, such as PM2.5, NO₂, and O₃. It is structured with fields representing geographical locations, demographic information (age group, sex), the type of pollutant, and the corresponding exposure levels for each year between 1990–2021. The dataset also includes upper and lower CIs, providing a comprehensive understanding of pollution trends over time.
The ILD and Sarcoidosis Incidence Dataset captures incidence rates of ILD and sarcoidosis across the USA, categorised by state, sex, and age group, with data from 1990–2021. Incidence data were expressed as the number of new cases in a year divided by the mid-year population size. This dataset similarly includes key metrics like incidence value and CIs, allowing for regional and demographic analysis of disease prevalence. Combining these datasets allowed the authors to examine for potential correlations between air pollution and respiratory disease incidence across multiple regions and demographics over a multi-decade period.
To interpret this data, several illustrations were created in Tableau™ (Salesforce Inc., San Francisco, California, USA), starting with geographical heat maps. One heat map depicted the distribution of ILD and sarcoidosis incidence across different states in the USA, with colour intensity representing the magnitude of disease incidence. This visualisation effectively highlighted regional trends, enabling a quick visual comparison of disease prevalence across states. Similar geographical heat maps were created to show the distribution of overall pollution levels by state and the distribution of particulate matter levels by state.
A graph depicting the trends in ILD incidence and pollution levels was constructed using longitudinal data. Both variables were plotted on the same timeline to visualise their temporal relationship and assess potential correlations.
Finally, a correlation plot (scatter plot) was produced to examine the relationship between air pollution and disease incidence. This scatter plot displayed the average air pollution values (from 1990–2021) on the X-axis and the average ILD and sarcoidosis incidence rates over the same period on the Y-axis. Each point represented a state, providing a visual comparison of pollution exposure and disease incidence across regions. This method allowed for a structured visual exploration of potential relationships between these variables.
RESULTS
In this study, the authors do not have a specific breakdown of PM2.5 concentrations. Instead, they have aggregated data on ambient particulate matter. The authors will use ambient particulate matter as a surrogate for PM2.5 due to the absence of PM2.5-specific concentration data across all study years. This measure is widely recognised in air quality and public health research to represent outdoor airborne particles, including fine particulate matter.
EPA-reported national mean PM2.5 concentrations showed a strong temporal correlation with GBD-derived SEVs for particulate matter pollution from 2000–2019 (Pearson r=0.98; Spearman r=0.97; p<0.001). Both datasets demonstrated parallel declining trends over time, with reductions in measured PM2.5 closely mirrored by decreases in modelled SEVs. This high degree of concordance supports the validity of GBD exposure estimates.
In population-weighted models adjusting for sex composition and a linear time trend, the association between particulate matter exposure (SEV) and ILD incidence was smaller and not statistically significant.
Air Pollution Exposure
Overall air pollution exposure, summarised using the GBD’s SEV (0–100 scale), varied widely across states in the USA (Figure 1). The highest levels of exposure were observed in California (20.7018), Illinois (20.3971), and the District of Columbia (20.0578), while the lowest exposure levels were reported in Hawaii (4.5844), Maine (5.2061), and Vermont (7.2544).
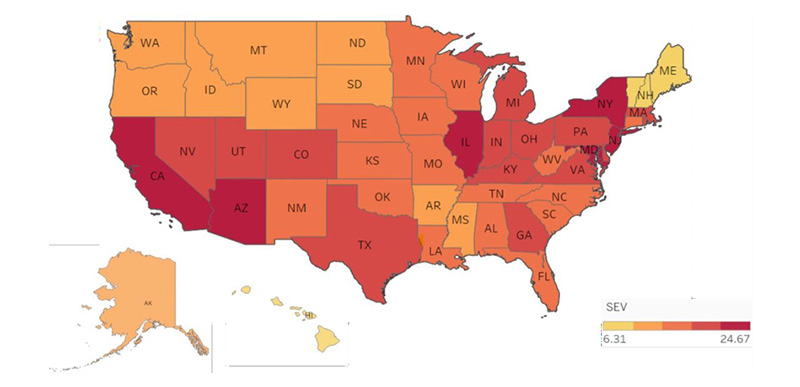
Figure 1: Heat map of the USA depicting state-wise severity of overall air pollution levels.
Units represent SEV unless otherwise specified. Data reflect state-level annual averages from 1990–2021. Seasonal fluctuations are not captured in this dataset, and ecological bias should be considered when interpreting results.
AK: Alaska; AL: Alabama; AR: Arkansas; AZ: Arizona; CA: California; CO: Colorado; FL: Florida; GA: Georgia; IA: Iowa; ID: Idaho; IL: Illinois; IN: Indiana; KS: Kansas; KY: Kentucky; LA: Louisiana; MA: Massachusetts; MD: Maryland; ME: Maine; MI: Michigan; MN: Minnesota; MO: Missouri; MS: Mississippi; MT: Montana; NC: North Carolina; ND: North Dakota; NE: Nebraska; NH: New Hampshire; NM: New Mexico; NV: Nevada; NY: New York; OH: Ohio; OK: Oklahoma; OR: Oregon; PA: Pennsylvania; SC: South Carolina; SD: South Dakota; SEV: Summary Exposure Values; TN: Tennessee; TX: Texas; UT: Utah; VA: Virginia; WA: Washington; WI: Wisconsin; WV: West Virginia; WY: Wyoming.
Air pollution exposure was additionally assessed using regulatory data from the EPA’s AQS. Particulate matter exposure was measured as annual mean PM2.5 concentrations (µg/m³), aggregated at the state level from ground-based monitoring networks. Gaseous pollutants included NO₂, reported as annual mean concentrations (ppb), and O₃, reported as the warm-season average of the daily maximum 8-hour concentration (ppb), consistent with EPA reporting standards. These measures reflect ambient pollutant concentrations rather than population-attributable risk; states with larger populations may exhibit higher SEVs despite lower or moderate long-term ambient concentrations, as SEVs are population-weighted exposure metrics.
Average ILD Incidence by State
The average age-standardised ILD incidence (per 100,000 persons) varied across states in the USA (Figure 2). The highest averages were observed in California (2,062.58 per 100,000), Florida (1,421.38), Texas (1,400.00), and New York (1,273.22), while Wyoming (33.90), Alaska (36.80), and North Dakota (42.30) reported the lowest averages.
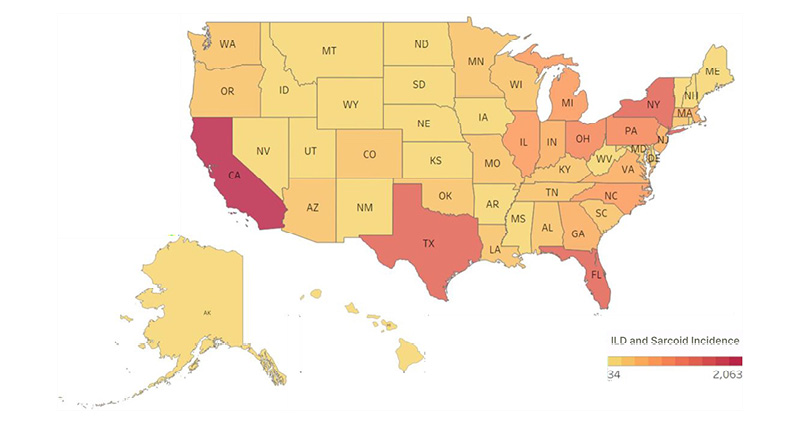
Figure 2: Heat map of the USA depicting state-wise incidence of ILD.
Units represent SEV unless otherwise specified. Data reflect state-level annual averages from 1990–2021. Seasonal fluctuations are not captured in this dataset, and ecological bias should be considered when interpreting results.
AK: Alaska; AL: Alabama; AR: Arkansas; AZ: Arizona; CA: California; CO: Colorado; FL: Florida; GA: Georgia; IA: Iowa; ID: Idaho; IL: Illinois; ILD: interstitial lung disease; IN: Indiana; KS: Kansas; KY: Kentucky; LA: Louisiana; MA: Massachusetts; MD: Maryland; ME: Maine; MI: Michigan; MN: Minnesota; MO: Missouri; MS: Mississippi; MT: Montana; NC: North Carolina; ND: North Dakota; NE: Nebraska; NH: New Hampshire; NM: New Mexico; NV: Nevada; NY: New York; OH: Ohio; OK: Oklahoma; OR: Oregon; PA: Pennsylvania; SC: South Carolina; SEV: Summary Exposure Values; SD: South Dakota; TN: Tennessee; TX: Texas; UT: Utah; VA: Virginia; WA: Washington; WI: Wisconsin; WV: West Virginia; WY: Wyoming.
Ambient Particulate Matter Exposure
Ambient particulate matter specifically refers to particles in the outdoor air, measured by their SEV. SEV is a composite metric scaled from 0–100 that reflects both the prevalence of exposure in the population and the relative risk associated with that exposure.
The average PM2.5 SEV across states in the USA varies significantly, with the District of Columbia recording the highest PM2.5 SEV at 18.89, followed closely by Georgia (18.72), California (18.48), Illinois (18.21), and Alabama (17.95; Supplementary Figure 1). These elevated SEVs are typically associated with dense urban areas or states with substantial industrial activity, contributing to higher particulate pollution.
States with the lowest average PM2.5 SEV include Hawaii (2.53), Wyoming (3.45), Maine (4.41), Montana (5.88), and North Dakota (5.99).
These lower SEVs are often found in states with fewer urban centres and less industrial presence, leading to better air quality.Overall air quality was summarised using the Air Quality Index (AQI), a standardised metric derived from EPA-reported concentrations of PM2.5, NO₂, O₃, and other criteria pollutants. State-level AQI values were averaged annually to reflect population-level exposure. Use of these EPA-based measures along with SEVs improves interpretability, providing clinically and regulatory familiar units, while preserving consistency with global exposure modelling.
Temporal Trends in Pollution Exposure and ILD Incidence
Air pollution exposure declined across most states in the USA between 1990–2021 (Figure 3). Higher pollution levels were observed in earlier years in states such as California, Illinois, and Georgia, with a general downward trend by 2021. In contrast, age-standardised ILD incidence increased over the same period across all USA states (Figure 3). California, Texas, and Florida consistently demonstrated the highest incidence rates, with a largely linear increase from 1990–2021.
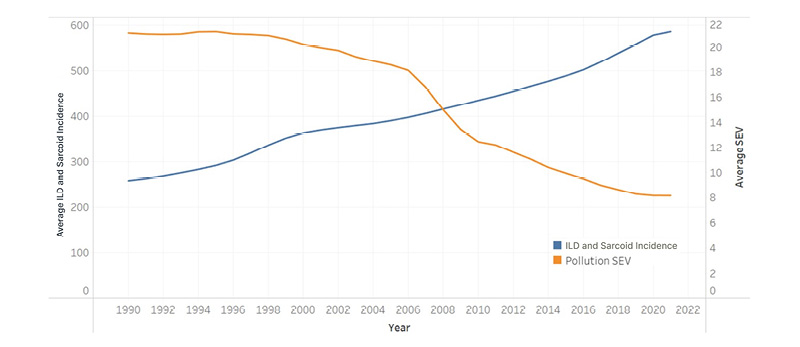
Figure 3: Comparative graph of ILD incidence trends and pollution levels (1990–2021).
Units represent SEV unless otherwise specified. Data reflect state-level annual averages from 1990–2021. Air pollution metrics declined over time across states, whereas ILD incidence increased steadily during the study period. Seasonal fluctuations are not captured in this dataset, and ecological bias should be considered when interpreting results.
ILD: interstitial lung disease; SEV: summary exposure values.
Correlation Between Air Pollution and ILD Incidence
The correlation chart between average air pollution exposure and ILD incidence demonstrates a positive relationship with a correlation coefficient (r=0.51; Supplementary Figure 2). States in the USA with higher air pollution levels, such as California, Texas, and New York, also had higher ILD incidence rates.
The line of best fit indicates a trend where states with greater exposure to pollutants tend to report higher ILD incidence.
DISCUSSION
ILD is linked to chronic exposure to air pollutants. Numerous studies highlight the association between air pollutants, such as PM2.5, NO₂, and O₃, and ILD progression. Recent evidence shows the relationship between air pollution and ILD. For example, a 2023 systematic review synthesised epidemiologic and mechanistic studies and concluded that long-term exposure to fine particulate matter accelerates fibrotic progression in patients with established ILD.9
The divergence between temporal and spatial patterns observed in this study requires careful interpretation. Although national air pollution levels declined over time, spatial analyses showed higher ILD incidence in regions with greater pollution burden. This is compatible with the effects of cumulative or historical exposure, regional variation in pollution levels, and delayed disease manifestation. Increasing ILD incidence over time may reflect population ageing and changes in disease recognition, including greater use of high-resolution CT and evolving diagnostic criteria.
Prior epidemiologic studies support an association between air pollution exposure and ILD incidence and progression. Long-term exposure to fine particulate matter has been linked to increased risk of IPF and worse clinical outcomes.1,10,11 Experimental studies suggest oxidative stress and inflammatory pathways contribute to fibrotic remodelling.
The role of particulate matter, particularly PM2.5, is central, as it generates reactive oxygen species that lead to oxidative stress, causing inflammation and tissue remodelling, critical factors in the pathogenesis of ILD.2,3,5,6 In a study by Sesé et al.,12 long-term exposure to PM2.5 was found to significantly increase mortality risk, with a hazard ratio of 7.93 per 10 µg/m³. In the authors’ analysis, states in the USA like California and Texas, with higher levels of air pollution and PM2.5, correlate with elevated ILD incidence, aligning with findings that link air pollution to ILD.1-3,5-7,12,13
Mechanisms of Injury: Oxidative Stress and Epithelial Damage
Research has illuminated the specific biological mechanisms by which pollutants contribute to lung damage in ILD. Superoxide production, prompted by exposure to PM2.5 and other pollutants, damages the epithelial cells lining the respiratory tract, weakening the lung’s structural integrity and facilitating fibrosis.2,14,15 Studies conducted on animal models show that this reactive oxygen species production results in oxidative stress, directly injuring epithelial cells and disrupting the lung barrier, which triggers inflammation and accelerates fibrotic changes.2
Communities with PM2.5 that contain higher concentrations of metals, like nickel, vanadium, and elemental carbon, face higher hospitalisation risks associated with short-term PM exposure, especially among individuals with pre-existing respiratory conditions.16,17 These metals, common in urban and industrial emissions, exacerbate oxidative stress in the lungs, reinforcing the idea that ILD severity and progression can depend on both the quantity and composition of pollutants in the environment.17
Functional Decline and Forced Vital Capacity
Air pollution is not only associated with ILD onset, but also significantly affects disease progression and functional decline.2,11 Forced vital capacity, a critical marker for ILD progression, declines more rapidly in patients exposed to high levels of PM2.5, highlighting the deteriorating effect of pollution on lung function.2,18 This decline in forced vital capacity is especially concerning as it correlates directly with ILD symptom severity and mortality risk, meaning that patients in highly polluted areas face a faster progression of functional impairment.1,2,11 Pollutant exposure has been associated with epithelial injury.2,5
The geographic distribution of ILD incidence aligns somewhat closely with pollution exposure levels, as states in the USA with elevated pollution, such as California, Texas, and New York, show higher rates of ILD. Conversely, states with lower pollution levels, such as Wyoming and Vermont, report comparatively low ILD incidence. However, additional factors like occupational exposures andlifestyle variables influence these patterns.19 Occupational studies have shown that individuals in industrial settings, particularly those exposed to dust and other pollutants, face elevated ILD risks and accelerated functional decline.19
Global Perspectives on Air Pollution and ILD
After observing a positive correlation between air pollution and ILD incidence in the USA, the authors sought to extend their analysis to countries such as China and India, where air pollution levels are significantly higher. This expansion aimed to explore whether regions with more severe pollution burdens exhibit stronger associations with ILD incidence and to better understand the global implicationsof air quality on respiratory health.
In China, where industrial emissions dominate, the correlation between air pollution and ILD is high (r=0.98). In India, a combination of industrial pollution and household air pollution, often from burning biomass fuels, drives a strong correlation (r=0.93) with ILD. Pakistan shows similar results (r=0.94), where many homes rely on polluting energy sources, like wood or coal for cooking. Even in Tajikistan, a country with fewer industrial emissions, ambient particulate matter still has a profound impact, showing a correlation of r=0.93 with ILD.
In contrast, the USA exhibits a more muted relationship between air pollution and ILD, largely due to decades of stringent regulatory efforts, such as the Clean Air Act.20 Despite these protections, ILD rates in the USA are still rising. Other factors, including occupational exposures, delayed disease onset, and differences in healthcare access, may contribute to this pattern.
The Paradox of Declining Pollution Versus Rising ILD Incidence
Despite reductions in air pollution from 1990–2021, ILD incidence has steadily risen, a trend that may have multiple explanations.
Delayed disease manifestation
ILD often develops slowly.2 Fibrosis and lung remodelling likely can manifest long after initial pollutant exposure.12 Individuals exposed to higher pollution levels in previous decades may only now be experiencing symptoms, contributing to the recent rise in ILD incidence despite improved air quality. This latency effect suggests that historical pollution exposure impacts current ILD trends, emphasising the long-term effects of past environmental conditions.
Ageing population
The demographic shift towards an older population likely amplifies ILD incidence,as age-related changes in lung structure and immune function increase susceptibility to fibrosis.11,21 This ageing trend exacerbates the prevalence of ILD in areas with already high pollution levels, highlighting the compounded risk factors of age and environmental exposure in patients with ILD.
Improved diagnostic precision
Advancements in diagnostic tools, especially high-resolution CT, have allowed earlier and more accurate ILD detection.19,22 This increase in diagnostic precision has likely contributed to the rise in reported ILD cases, paralleling trends seen in other chronic conditions where advanced diagnostic technology has revealed previously undetected cases.2
Other environmental/occupational exposures
Occupational exposures to dust, chemical fumes, and metal pollutants significantly increase the risk of lung injury and fibrosis. A meta-analysis found that 44% of IPF cases had exposure to vapours, gas, dust, and fumes, with a pooled odds ratio (OR) of 1.8 and a population attributable fraction of 21%.23 Another study identified increased IPF risk associated with metal dust (OR: 1.83), wood dust (OR: 1.62), and pesticide exposure (OR: 2.07).19
Public Health and Policy Recommendations
Evidence suggests that reducing air pollution has immediate and long-term benefits for respiratory health, particularly for elderly populations and individuals with chronic lung conditions.11 Community programmes encouraging individuals to reduce outdoor activities during peak pollution times and use air filtration indoors could also help mitigate exposure-related ILD risks.24
Monitoring long-term trends in both air quality and ILD incidence may help identify emerging risks and inform future research.21 Long-term cohort studies are especially important to monitor individual pollutant exposure and subsequent health outcomes, providing clearer causal links between pollution and ILD.2,18
Limitations and Future Directions
Several limitations should be considered when interpreting these findings. This study used an ecological design based on aggregated, state-level data, and associations observed at the population level may not reflect individual exposure–outcome relationships. Within-state heterogeneity in air pollution exposure, disease burden, and access to healthcare was not captured. Accordingly, the results should be interpreted as population-level patterns rather than individual risk estimates.
State-level estimates of both ILD incidence and air pollution exposure are subject to temporal and spatial variability. Air pollution concentrations vary within states due to differences in urbanisation, industrial activity, meteorological conditions, and monitoring coverage, while ILD incidence may be influenced by regional variation in diagnostic practices and reporting. The use of annual, state-level averages may therefore obscure short-term fluctuations and within-state heterogeneity, potentially resulting in exposure or outcome misclassification. To reduce the impact of episodic events and measurement variability, analyses focused on long-term trends and multi-year averages. The consistency of spatial patterns observed across multiple exposure metrics, including EPA-based particulate and gaseous measures and SEVs, supports the robustness of the population-level findings.
Population-weighted regression models were used to account for differences in state population size and temporal trends. However, there’s a high likelihood of residual confounding given that important individual-level risk factors for ILD, such as smoking history, occupational and environmental exposures, socioeconomic factors, and access to specialised diagnostic services, were not directly measured and may have contributed to observed spatial and temporal variation in ILD incidence.
This analysis was also limited by the lack of PM2.5-specific concentration data for all study years, necessitating the use of aggregated ambient particulate matter as a proxy. While this approach is widely used in air quality research, it may introduce exposure misclassification.
Finally, the absence of individual-level data and precise geocoding limited the ability to directly link ILD cases to local air pollution exposure. Future studies using finer geographic resolution, geocoded and time-varying exposure data, and detailed clinical phenotyping will be important for clarifying temporal relationships, dose–response patterns, and potential effect modification by age, smoking, and occupational co-exposures.
CONCLUSION
This ecological analysis identified a moderate population-level association between air pollution exposure and ILD incidence in the USA (r=0.51). These findings are consistent with prior epidemiologic studies linking chronic exposure to air pollutants with fibrotic lung disease. However, these associations were observed alongside declining national pollution levels over time and should therefore be interpreted cautiously.
The findings likely reflect a combination of cumulative and historical exposure, regional heterogeneity in pollution burden, population ageing, and changes in diagnostic practices rather than a direct causal relationship. Also, unmeasured factors, such as smoking history, occupational exposures, and socioeconomic differences, may have contributed to the observed variation in ILD incidence across states.
While causality cannot be inferred from this ecological design, the results suggest that geographic differences in air pollution exposure remain relevant to ILD burden at the population level. Further studies incorporating individual-level exposure assessment, finer geographic resolution, and longitudinal follow-up are needed to clarify the role of air pollution in ILD development and progression.