BACKGROUND AND AIMS
Resistant epilepsies account for approximately 30% of all forms of epilepsy, particularly in patients with focal seizures.1,2 One of the main causes of therapy-resistant focal epilepsies is focal cortical dysplasias (FCD), which is attributed to abnormal cortical development. Among all abnormalities of cortical development, FCD in surgically treated children amounts to 75%. Among the various variants of FCD, FCD Types Ia and IIb are the most common. FCD Types Ib, Ic, and IIa are extremely rare.2,3 The transmantle sign (TMS) is considered a characteristic feature for visualisation of FCD IIb.4,5 In this study, the authors sought to answer the following questions: is Type IIb FCD always accompanied by a TMS, and will this finding be characteristic of other types of FCD? The aim was to assess the concordance between typical MRI patterns and histologically confirmed FCD IIb, and to determine the diagnostic value of these imaging features.
MATERIALS AND METHODS
The study included 93 patients who had undergone surgery for FCD.6 Based on histopathological examination, all patients were divided into two groups (minimum age in both groups was 3 years): Group 1 with Type I FCD (37 cases) and Group 2 with Type IIb FCD (56 cases). All patients underwent preoperative MRI on 3T scanners using the HARNESS protocol and high-resolution T2-weighted sequences (slice thickness 0.6 mm), with an emphasis on identifying cortical abnormalities such as the TMS, cortical thickening, blurred grey-white matter boundary, and increased signal from the subcortical white matter.
RESULTS
As a result of assessing the TMS of interest, the authors identified the following relationships. TMS was detected on MRI in 36 of 56 patients with FCD Type IIb (64.3%; 95% CI: 50.9–76.0%) and in none of the patients with FCD Type I. Demographic data showed a mean age of 17.2±6.4 years in the FCD IIb group (range: 3–32 years), and 57.1% females; and a mean age of 19.5±7.2 years (range: 3–35 years) in the FCD I group, with 51.4% females. The difference between groups was statistically significant (Fisher’s exact test; p<0.0001). Sensitivity was 64.3% and specificity was 100%, with a positive predictive value of 100%, and a negative predictive value of 65.5% (Figure 1).
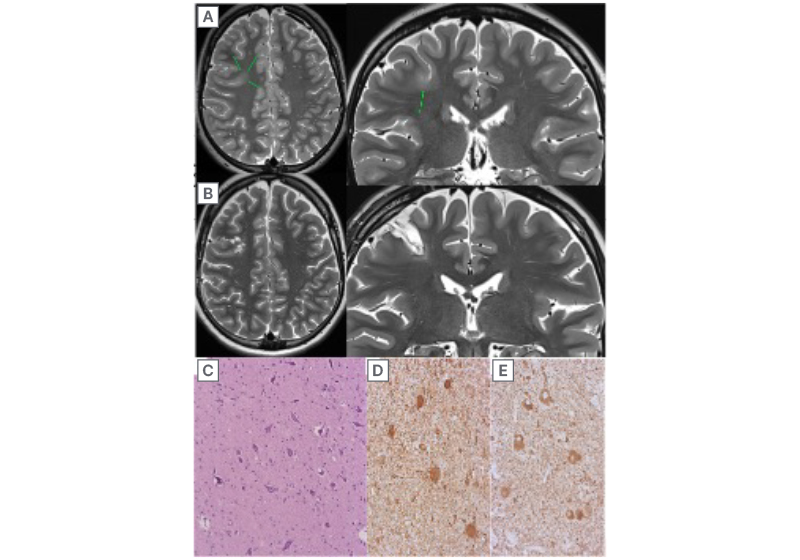
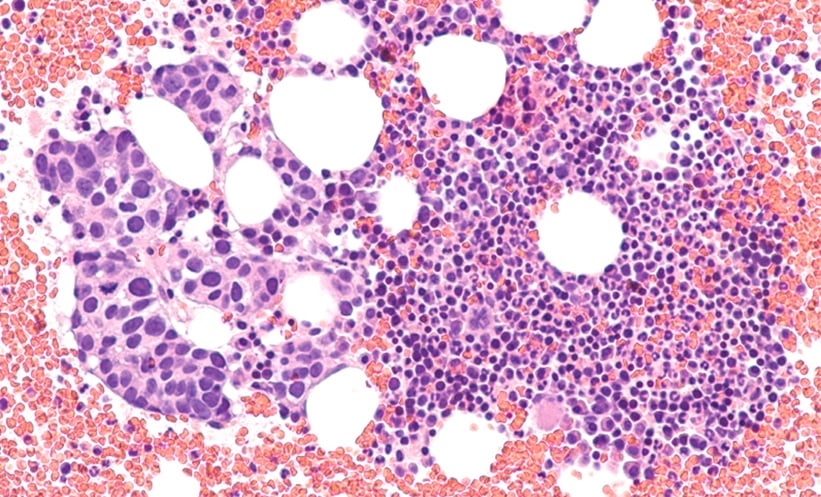
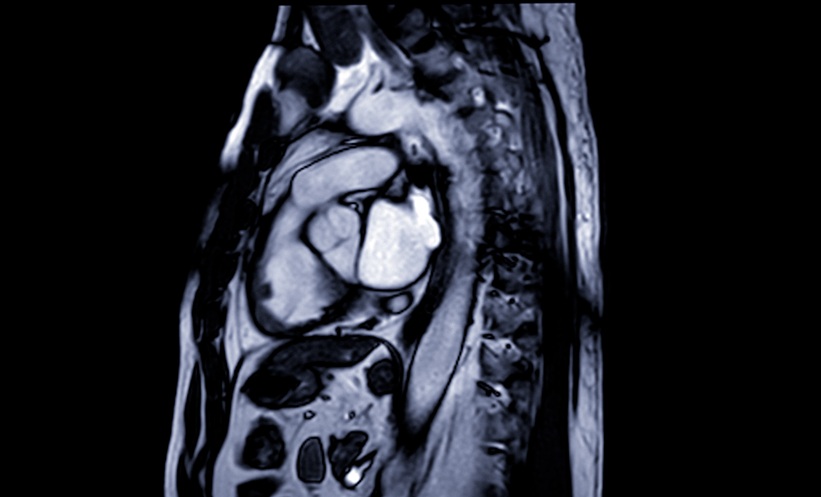
Figure 1: Focal cortical dysplasia Type IIb of the right frontal lobe.
Condition before surgery (A) and after surgery (B). The transmantle symptom was not visualised before surgery. The data were confirmed histologically (C) and immunohistochemically (D, E). C) Accumulation of pathological forms of neurons surrounded by fibrous gliosis, staining with haematoxylin and eosin. D) Balloon cells, vim expression. E) Dysmorphic neurons, expression of neurofilaments.7
CONCLUSION
The TMS demonstrates high specificity (100%) for identifying FCD IIb, with statistically significant differences between FCD IIb and FCD I groups (p<0.0001; Fisher’s exact test). However, its moderate sensitivity (64.3%) indicates substantial limitations in the diagnostic value of this marker.