Interview Summary
With the increasing global prevalence of steatotic liver disease (SLD), there is a growing demand for fast, accurate, and low-cost diagnostic methods. This interview summarises the insights of expert gastroenterologists who participated in a series of videos focusing on the evolving global prevalence of liver disease. Alina Popescu, Felix Bende, Roxana Sirli, and Ioan Sporea, Department of Gastroenterology and Hepatology, Victor Babeș University of Medicine and Pharmacy, Timișoara, Romania, shared their clinical insight and recommendations regarding best-practice diagnosis and assessment using multiparametric ultrasound technology. They highlighted gold-standard recommendations for the diagnosis of liver diseases, the advantages and limitations of different diagnostic approaches, and emphasised the importance of early diagnosis and intervention to prevent metabolic dysfunction-associated steatotic liver disease (MASLD) from progressing to its most severe form of the disease, metabolic dysfunction-associated steatohepatitis (MASH). Each expert explored a patient case study from their clinical practice, navigating patient presentation, real-world assessment, and outcomes when using a high mid-range AI-powered multiparametric ultrasound system (LOGIQ Totus™, GE HealthCare), a recent advancement in diagnostic ultrasound for liver disease.
THE ESCALATING PREVALENCE OF CHRONIC LIVER DISEASE
Liver disease is characterised by hepatocyte injury, inflammatory cell infiltration, and activation of hepatic stellate cells (HSC), causing liver dysfunction and disruption.1 Globally, cases of SLD are on the rise, and MASLD (previously known as non-alcoholic fatty liver disease) is now the most common cause of chronic liver disease globally.2,3 A recent meta-analysis revealed that 38% of adults worldwide have MASLD, (between 2016–2019), reflecting a 50% increase since 1990–2006.4
Disease epidemiology varies between world regions, and the increasing prevalence of MASLD is closely associated with rising numbers of obesity and Type 2 diabetes.2,3 The incidence of alcoholic liver disease is also on the rise, in line with an increase in global alcohol consumption.1
Popescu echoed this paradigm shift with recent observations from her clinical practice: “Among the most common causes of chronic liver disease in our centre’s experience are viral causes, namely hepatitis B and D, as well as MASLD. The increase in obesity, diabetes, and metabolic syndrome have led to the increased frequency of steatotic liver in all of its facets.”
The prevalence of MASLD is projected to increase significantly across several world regions,1-4 with forecasts predicting a global prevalence of MASLD to reach 55.4% by 2040.4 Early diagnosis and intervention are paramount to prevent the disease from progressing to MASH. MASH is the most severe form of MASLD, and can result in cirrhosis, liver failure, and liver cancer.5,6 Popescu added that: “Even in advanced stages, chronic liver disease can be asymptomatic and silent. The patient will usually consult the doctor due to an accidental discovery of elevated transaminase levels.”
From an initial accumulation of fat (steatosis), the liver becomes inflamed. If this lipid accumulation is prolonged, the liver enters a chronic inflammatory response, and progresses to end-stage liver disease, including fibrosis, cirrhosis, and finally hepatocellular carcinoma.1,5 MASLD is detectable and preventable, yet prevalence is on the rise. As such, global organisations are calling for action to tackle the global health burden of MASLD and prevent widespread progression to MASH.6
Current guidelines regarding first-line diagnostic recommendations vary. The European Association for the Study of the Liver (EASL) recommends ultrasound as the first-line diagnostic procedure, discouraging MRI use due to high cost.7 Conversely, the American Association for the Study of Liver Diseases (AASLD) recommends MRI-proton density fat fraction and vibration-controlled transient elastography as the first-line diagnostic approach.8
THE DEMAND FOR NON-INVASIVE DIAGNOSTICS
Liver biopsy histological analysis is the current gold-standard for the diagnosis of liver disease.9,10 Biopsies can determine the degree of steatosis, necroinflammatory activity, and extent of fibrosis, allowing the clinician to distinguish disease staging, severity, and treatment indication.10 Despite its gold-standard status, the invasive procedure is not without risk, and may result in life-threatening complications.10,11 Moreover, limitations in both sampling and intra/interobserver variabilities in fibrosis staging mean the method is unfeasible for large-scale screening.10,11
As the global prevalence of liver disease rises, the diagnostic focus has shifted toward alternative non-invasive approaches. MRI-proton density fat fraction is an increasingly used, non-invasive technique that accurately evaluates liver fat fraction. However, it is costly, access is limited, and it cannot be used for routine screening and monitoring.12 Popescu remarked that MRI “takes weeks for an appointment, during which you can imagine the worry of the patient”.
Traditional brightness mode (B-Mode) 2D ultrasound is another commonly used, quick, and cost-effective non-invasive technique that can detect liver texture changes and hepatic steatosis, but also liver texture changes suggestive of advanced fibrosis.10 Recalling a patient case, Popescu explained: “If you take only one sign, the irregular surface of the liver is the most sensitive sign of liver cirrhosis.” Once severe liver damage is suspected through ultrasound imaging, Popescu assessed for splenomegaly and gallbladder thickness to add to the signs of advanced liver disease, explaining that: “Ultrasound is the most sensitive and easy tool to measure the spleen, due to its accessibility, non-invasiveness and lack of radiation.”
However, B-Mode ultrasound does not allow for quantitative assessment of fat infiltration, as liver texture and brightness may vary depending on imaging parameters or sonographer technique, and cannot quantify the degree of fibrosis. Moreover, sensitivity is decreased in patients with obesity or mild steatosis, and can be affected by intraobserver subjectivity.10-14
Alternative well established non-invasive methods, using elastography and attenuation to assess liver fibrosis and steatosis without imaging guidance, are known to be painless, reproducible and fast, but can be unreliable in patients with obesity, those with ascites, and cases of mild/moderate fibrosis.10 Popescu also noted that technological developments within ultrasound include additional functions and parameters, enhancingthe versatility and effectiveness ofclinical examinations.
BOTTLENECKS IN THE DIAGNOSTIC JOURNEY
Diagnosing and managing liver disease remains a challenge, due to a limited awareness of the disease, its asymptomatic nature, a lack of alignment in diagnostic pathways and expert usage of a specific technique, and a lack of approved pharmacological treatments.15 The experts discussed the use of multiparametric ultrasound imaging in their clinical practice for scanning, diagnosing, and assessing liver disease, as well as the use of AI-powered ultrasound multiparametric technology in real-world patient cases.
Popescu highlighted the difficulties and time-consuming nature of confirming a diagnosis in all its pathological aspects: “When there is a focal liver lesion, fibrosis or steatosis, you have to refer the patient for another investigation. This can be expensive and time-consuming.”
This diagnostic complexity presents challenges for patients as well as clinicians. Sirli recalled a particular patient evaluation where the patient became agitated once she knew Sirli had identified a lesion. Bende said: “If we have a focal liver lesion in a standard ultrasound, we order another investigation, such as CT or MRI. These are expensive, and the waiting time can be over a month. During this time, the patient may be afraid of a severe problem.” Additionally, in CT imaging, the patient will undergo radiation exposure.16
Popescu highlighted that practitioners have previously struggled to interpret results of ultrasound-based elastography, as different ultrasound techniques and devices from ultrasound vendors required specific cut-offs. In 2020, a consensus statement update to the Society of Radiologists in Ultrasound on liver elastography proposed the ‘Rule of 4’, facilitating easier application in clinical settings, aiming to decrease variability across different ultrasound vendors and provide clearer guidance on the assessment of liver disease.17 Recommendations for interpreting liver stiffness values obtained with acoustic radiation force impulse-based techniques in patients with viral hepatitis and MASLD are as follows:17
A stiffness value of ≤5 kPa (1.3 m/sec) suggests a high probability of the liver being normal.
A value of <9 kPa (1.7 m/sec) in the absence of other known clinical signs, indicates that compensated advanced chronic liver disease (cACLD) is unlikely. If there are known clinical signs, further testing may be needed for confirmation.
A value between 9–13 kPa (1.7–2.1 m/sec) is indicative of possible cACLD but requires additional tests for confirmation.
A value >13 kPa (2.1 m/sec) rules in cACLD.
A value >17 kPa (2.4 m/sec) is suggestive of clinically significant portal hypertension.
MULTIPARAMETRIC ULTRASOUND IN CLINICAL PRACTICE
The experts recognised the major role of ultrasound in the diagnosis of chronic liver disease.16,18 It is the most widely used non-invasive diagnostic method, and different functional parameters enable diagnosis through measurements including diffuse hyperechoic echotexture, deep attenuation, liver echotexture homogeneity, and vascular blurring.16
Once first-line diagnostic ultrasound has detected abnormal texture in the liver, pathological features such as steatosis and fibrosis help to define the disease stage.19 When using multiparametric ultrasound, pre-existing features within the device can assess other pathological features within one clinical evaluation.19 A multiparametric ultrasound device can contain an embedded range of parameters to assess and diagnose liver disease, including B-Mode, contrast-enhanced ultrasound (CEUS), vascular assessment, and quantitative assessment techniques for liver stiffness and steatosis.11,19
Embedded within the multiparametric ultrasound, ultrasound-guided attenuation parameter (UGAP) is a real-time, image-guided, quantitative method that assesses liver attenuation, which is an indicator of steatosis, using an automated algorithmic approach. UGAP has proven intra/interobserver reliability regardless of patient status.20,21
2D shear wave elastography (2D-SWE) measures liver stiffness, which is correlated to the degree of fibrosis. This is displayed as a real-time colour map of tissue elasticity, superimposable with B-Mode ultrasound.22 Alongside the UGAP parameter, Popescu commented that the technology can be used “to quantify attenuation and find out if the patient has steatosis and liver fibrosis, […] even if the patient has ascites”.
Popescu described a 46-year-old male patient presenting to the emergency room with abdominal discomfort. Further consultation found the patient’s alcohol intake exceeded 30 units a day. Carrying out B-Mode examination, Popescu noted the irregular surface of the liver, which was brighter than the kidney. While this was the most sensitive sign, it did not, on its own, determine cirrhosis, she explained. Imaging of the gallbladder displayed a hypoechoic, posterior shadow, indicating gallstones and a thickened wall, and an enlarged spleen. Popescu noted there were several signs of chronic liver disease in this patient and that quickly investigating all signs is imperative. By using the same machine for UGAP and elastography, she went on and was able to confirm the presence of advanced chronic liver disease.
Metabolic Dysfunction-Associated Steatotic Liver Disease, Obesity, and Ultrasound
The prevalence of MASLD, which is associated with metabolic syndrome, Type 2 diabetes, and obesity, has been estimated at 60–95% in patients with obesity. Yet ultrasound, the most widely used non-invasive diagnostic approach in liver disease, exhibits lower sensitivity in people who are severely obese.13
Sporea described a case involving a 42-year-old patient who is overweight. With a BMI of 29, investigation revealed mildly elevated aminotransferases and hepatitis B with a low viraemic load. Initial B-Mode ultrasound revealed a degree of steatosis and excluded splenomegaly. UGAP then allowed quantitative evaluation of steatosis as severe (Figure 1).
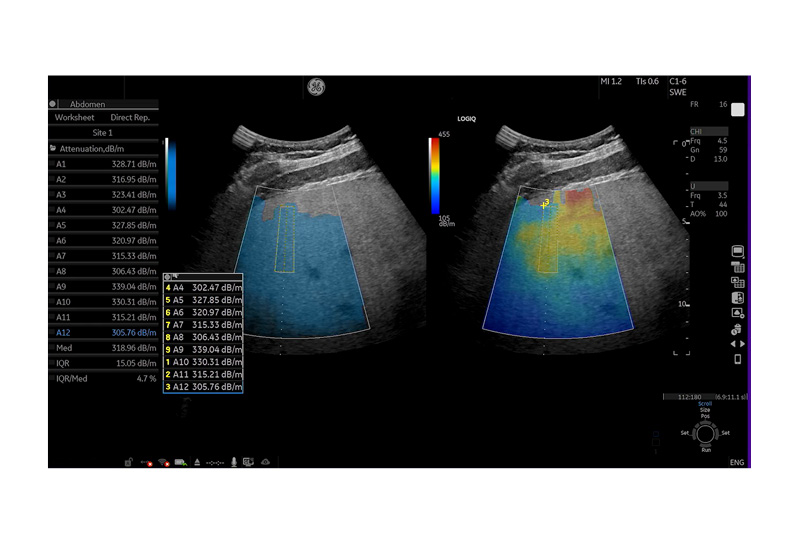
Figure 1: Ultrasound-guided attenuation parameter quantification of liver steatosis in patient.
Values A1-12 indicate severe steatosis.
dB/m: decibels per metre.
To investigate further, Sporea carried out 2D-SWE, and excluded significant fibrosis. With confirmed steatosis but no fibrosis, a follow-up period was ordered for viraemic evaluation and to encourage the patient to make some lifestyle changes. B-Mode ultrasound, UGAP, and 2D-SWE were all carried out in a single evaluation, he noted. Otherwise, he continued, “the patient would have been sent for an ultrasound, then separate fibrosis evaluation and liver fat quantification”.
Sporea emphasised the time saved when using a multiparametric ultrasound, explaining that “everything is in one room, and evaluation happens within a short time”. Additionally, the clinicians emphasised the importance of a user-friendly, intuitive system to improve clinical confidence and operator dependency.
Focal Liver Lesions and Multiparametric Ultrasound
CEUS enables clinicians to detect and characterise focal liver lesions in real-time23,24 (Figure 2 and 3).
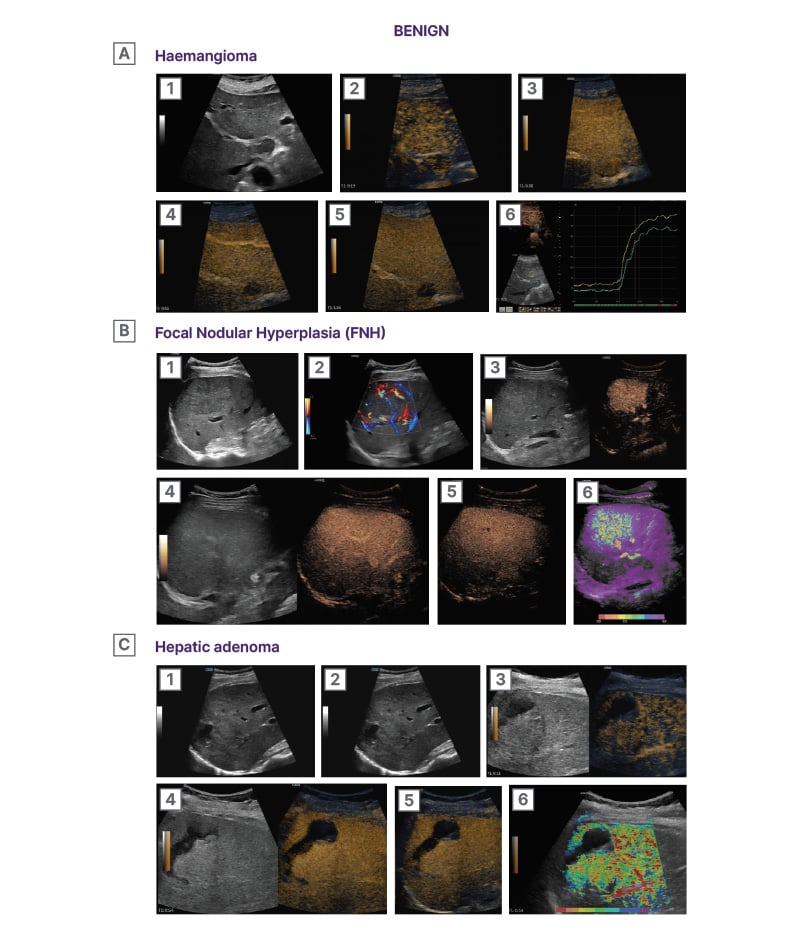
Figure 2: Characterisation of benign focal liver lesions using CEUS.22
A1) B-mode image showing a subcapsular predominantly hyperechogenic lesion (arrow) in hepatic segment VI. The lesion is well-demarcated and smooth-bordered. A2) B-flow image showing blood flow signals positioned in a peripheral nodular pattern (arrows). A3) Early arterial phase (9 seconds) CEUS image showing arterial phase hyper-enhancement in a peripheral, nodular, and discontinuous pattern (arrows). Micro-bubbles uptake in the enhancing parts of the lesion equals that of arteries. The central part of the lesion is non-enhancing at this stage (asterisk). A4) Later arterial phase (16 seconds) CEUS image showing a gradual centripetal pattern of enhancement. The micro-bubbles move towards the central part of the lesion, while intense enhancement is sustained at the periphery. A5) Portal-venous phase (54 seconds) CEUS image showing homogeneous enhancement of the lesion. Note the enhancement of the lesion is higher compared to the adjacent liver parenchyma and similar to the juxtapositioned vessels (arrows). A6) Parametric CEUS image adjusted at 5 seconds of enhancement timing. The centripetal pattern of arterial phase enhancement is confirmed. The micro-bubbles initially appear at the periphery of the lesion, forming globules and then gradually and slowly move toward the centre of the lesion (purple central area).
B1) B-mode image showing a large focal liver lesion (asterisk). The lesion is ill-defined and has a similar echogenicity to the adjacent liver parenchyma, making it difficult to be discerned. B2) Colour Doppler hybrid image showing the hypervascularity of the lesion. Note the presence of a feeding artery (arrow) and the abundance of internal blood flow signals throughout the lesion. Arteries can be seen positioned in a ‘spoke-wheel’ appearance radiating from a central stellate vascular structure (arrow). B3) Early arterial phase (12 seconds) CEUS image showing quick and homogeneous enhancement of the lesion (arrows). The lesion quickly uptakes micro-bubbles earlier and at a higher degree than the adjacent parenchyma. The lesion enhances similarly to the juxtapositioned blood vessels (arrows), being a highly vascularised lesion. B4) Portal venous phase (47 seconds) CEUS image showing homogeneous enhancement of the lesion. The lesion is now iso-enhancing to the adjacent parenchyma and cannot be easily discerned. B5) Delayed phase (2:10) CEUS image showing sustained homogeneous enhancement of the lesion. Note the presence of a centrally located non enhancing linear structure, representing a central scar (arrowhead). B6) CEUS parametric image adjusted at 5 seconds, given the quick arterial enhancement of the lesion. The lesion demonstrates a centrifugal pattern of enhancement, meaning that micro-bubbles initially appear at the central part of the lesion and then quickly move toward the periphery. Note the presence of feeding arteries (arrow head).
C1) B-mode image showing a mixed echogenicity ill-defined lesion (outlined by arrows). Note the presence of anechoic areas in keeping with necrosis or previous episode of haemorrhage (asterisk). C2) Colour Doppler image showing peripheral blood flow signals (arrows). These signals correspond to peripherally located feeding vessels. C3) Arterial phase (11 seconds) CEUS image showing mild arterial phase hyper-enhancement of the lesion (arrows). Note is made of peripherally located feeding arteries. The haemorrhagic material does not show any enhancement (asterisk). C4) Portal-venous phase (54 seconds) CEUS image showing the lesion iso-enhancing to the adjacent liver parenchyma. The lesions’ margins cannot be discerned. The haemorrhagic material does not show any enhancement, excluding active haemorrhage (asterisk). C5) Delayed phase (4:29) CEUS image showing the lesion still iso-enhancing to the adjacent liver parenchyma. The absence of wash-out even at this delayed stage is suggestive of a benign lesion. The haemorrhagic material is still non-enhancing (asterisk). C6) CEUS parametric image adjusted at 4.7 seconds, based on the rapid arterial enhancement of the lesion. The lesion demonstrates a centripetal pattern of enhancement, meaning that micro-bubbles initially appear at the periphery of the lesion (arrows), originating from the feeding arteries and then gradually move toward the central part of the lesion (asterisk).
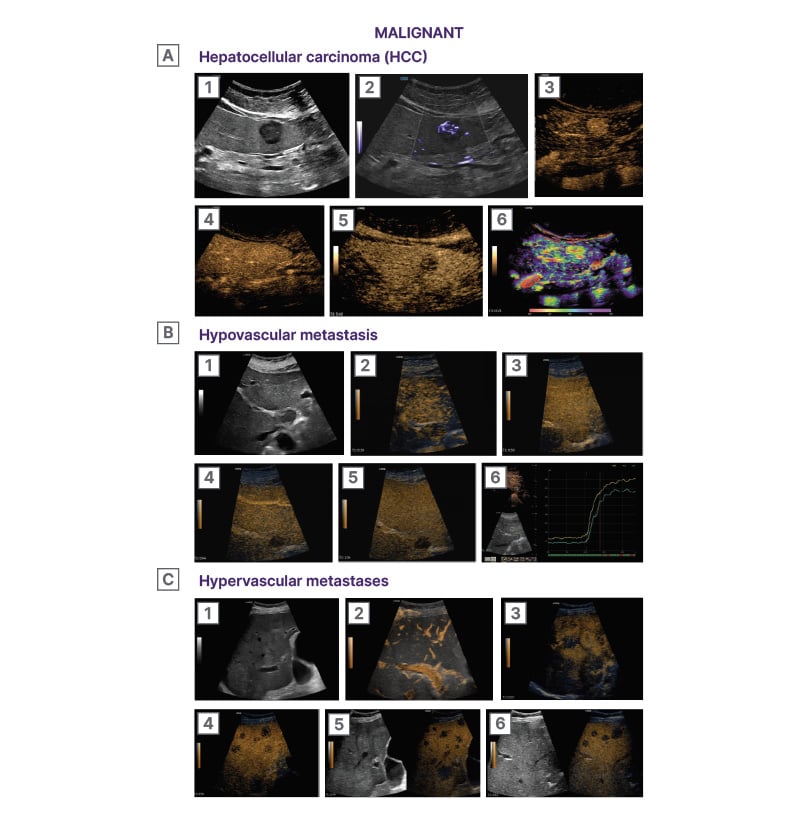
Figure 3: Characterisation of malignant focal liver lesions using CEUS.22
A1) B-mode image showing a rounded hypoechoic lesion in the right liver lobe (asterisk). The lesion is subcapsular in location and has lobulated margins. A2) Microvascular imaging (MVI) image illustrating the internal vascular architecture of the lesion. The lesion exhibits a rich network of internal irregular blood vessels. Note the origin of the vascular branches from a single feeding artery (arrow). The term ‘basket’ pattern of vascularity has been used to describe HCC vascularity. A3) Arterial phase (0:17) CEUS image showing clear and homogeneous arterial phase hyper-enhancement of the lesion (arrow). The lesion uptakes the micro-bubbles prior to the adjacent parenchyma and at a higher grade. A4) Portal venous phase (0:52) CEUS image showing the lesion iso-enhancing to the adjacent liver. The 1st minute is an important timepoint as wash-out prior to this point suggests a malignancy of non-hepatocellular origin in the setting of liver cirrhosis. A5) Delayed phase (5:42) CEUS image showing wash-out
of the lesion (asterisk), which is now hypo-enhancing to the adjacent liver. Lesions in cirrhotic liver should be followed up for up to 6 minutes, as even late phase wash-out indicates a malignancy of hepatocellular origin. A6) CEUS parametric image adjusted at 8 seconds, based on the rapid arterial enhancement of the lesion. The lesion demonstrates a rather homogeneous and rapid pattern of enhancement. Note the presence of feeding arteries inside the lesion (asterisks).
B1) B-mode image showing a rounded hypoechoic lesion in hepatic segment I. (asterisk). The lesion is homogeneous in echogenicity and has smooth borders. B2) Early arterial phase (0:19) CEUS image showing the lesion (asterisk) as hypo-enhancing compared with the adjacent normal liver parenchyma. The lesion uptakes micro-bubbles at a lower rate than the liver parenchyma. B3) Late arterial phase (0:30) CEUS image showing the lesion (asterisk) iso-enhancing to the adjacent parenchyma. The lesion has uptaken micro-bubbles at the same degree with the parenchyma but with a slower rate. B4) Portal venous phase (0:44) CEUS image showing the lesion (asterisk) with early and marked wash-out. The lesion has retained only a minimal degree of enhancement, starting prior to the time cut-off of 1 minute, a criterion in keeping with malignancy and specifically metastatic disease. B5) Delayed phase (1:54) CEUS image showing the lesion (asterisk) completely wash-out. There are essentially no micro-bubbles circulating inside the lesion, which appears as a ‘black hole’. B6) Time-intensity-curve analysis showing that the lesion (green curve) uptakes the contrast with a slower rate and at a lower degree than the adjacent liver parenchyma (yellow curve). This pattern is in keeping with a hypovascular metastasis, particularly in the setting of a patient with a known primary colon cancer. Objective quantitative parameters can be derived from this type of analysis, useful for prospective monitoring of treatment response to anti-angiogenetic treatment.
C1) B-mode image showing multiple mildly hyperechoic lesions (asterisks) throughout the right liver lobe in a patient with known primary colon cancer. Some of the lesions have a hypoechoic halo, in keeping with ‘target’ appearance. C2) B-Flow image revealing peripheral blood flow signals in some of the lesions (asterisks). The peripheral vascularity pattern follows the hypovascular halo finding on B-mode. C3) Late arterial phase (0:25) CEUS image showing arterial phase hyper-enhancement of the lesions (asterisks) in a peripheral ‘rim’ like pattern. The lesions uptake the micro-bubbles quicker than the normal liver parenchyma and at a higher degree, especially in their periphery, and later at their central part. C4) Portal venous phase (0:59) CEUS image showing early and intense wash-out of the lesions (asterisks). Following their arterial phase hyper-enhancement, the lesions washed-out quickly and intensely, prior to the cut-off of 1 minute. This pattern of wash-out is suggestive of malignancy and specifically hypervascular metastatic disease. C5) Delayed phase (3:44) CEUS image showing the lesions (asterisk) completely wash-out. There are essentially no micro-bubbles circulating inside the lesions, which appear as a ‘black holes’. C6) During the delayed phase and once the vascularity pattern of liver metastases is established, a ‘swipe through’ examination of the entire liver parenchyma should be performed in every patient assessed for liver metastatic disease, in order to assess the extent (number and size) of liver metastases. In this delayed phase (3:44) CEUS image, multiple metastases can be seen as washed-out lesions. The wash-out appearance enables the detection of metastases which could be missed on B-mode due to similar echogenicity with
the liver parenchyma.
In a patient presenting with abdominal discomfort, Bende explained, B-Mode ultrasound displayed hyperechoic lesions in the gallbladder with posterior shadowing, and a slight hyperechoic lesion on the left lobe of the liver. A slightly hyperechoic lesion is usually hard to see, explained Bende, adding: “When we discovered this lesion in the liver, we immediately went to perform a contrast-enhanced ultrasound.”
CEUS revealed ring-like arterial phase enhancement, characteristic of haemangioma. In the late phase, the lesion displayed no washout, and Bende confirmed no malignancy. The central area did not enhance, from which he concluded haemangioma with central thromboses. Bende commented: “With contrast enhance ultrasound […], we can evaluate focal liver lesions and incidentalomas within the same examination.” They explained that there is “no need to schedule another appointment for contrast/CT/MRI if the lesion has a typical CEUS pattern for a benign lesion, for example”.
Sirli shared her clinical insights from a patient presenting with an abdominal complaint. B-Mode ultrasound revealed an uncharacteristic small hypoechoic lesion in the left liver lobe. To investigate further, “I could perform contrast-enhanced ultrasound immediately after B-Mode examination. In 10–15 minutes, I was able to tell them they have no worries […] otherwise, I would have had to send the patient for an MRI or CT, and it would have taken weeks for them to get an appointment,” said Sirli. After confirming the lesion as focal nodular hyperplasia through CEUS, Sirli was able to make a diagnosis in 10 minutes.
Popescu noted that focal liver lesions (FLL) are often detected in routine abdominal ultrasound, and although frequently benign, need further examination to determine an exact diagnosis. She explained how multiparametric ultrasound can evaluate the vascularisation and stiffness of the liver and FLL, and that the severity of liver fibrosis can be determined or ruled out using elastography. Then, by quantifying FLL perfusion using CEUS in portal and late phases assesses the presence of washout suggestive for malignancy; and finally, CEUS enhancement in the arterial phase allows for a positive diagnosis of the lesion.
If the diagnosis is still inconclusive, CT and MRI are recommended, or Popescu explained that liver biopsy for certain aetiologies or cases in which non-invasive methods cannot establish a final diagnosis. “Multiparametric ultrasound devices,” remarked Popescu, “have been successfully implemented for disease evaluation across multiple pathologies, for example parathyroid lesions, thyroid nodules, prostate cancer and breast lesions.”
The Future of Chronic Liver Disease
Popescu weighed up the possibilities of large-scale quantitative screening for those at risk of chronic liver disease, explaining that screening the asymptomatic population would enable early disease detection, initiation of lifestyle changes and therapeutic intervention, and therefore decrease the number of patients reaching cirrhosis and end-stage disease. Moreover, she commented, early diagnoses would improve patient quality of life, social integration, and alleviate the burden on healthcare systems managing the complex disease. Additionally, she added, with the development of novel therapeutics for MASH,25 the role of ultrasound will not only be prominent in establishing early diagnoses but also in the continual monitoring of therapeutic effect and disease evolution in patients receiving treatment.
CONCLUSION
As the prevalence of chronic liver disease rises across the globe, experts from the Department of Gastroenterology and Hepatology, Victor Babeș University of Medicine and Pharmacy, emphasised the growing need for prompt diagnosis, disease staging, and intervention. To fulfil these unmet needs within the chronic liver disease diagnostic landscape, it is crucial that healthcare professionals streamline their approaches, initiate liver assessment promptly, and utilise screening methods that rapid, accessible, and comprehensive, such as multiparametric ultrasound. As Popescu highlighted, the early detection and precise staging of liver disease are crucial for the initiation of lifestyle changes or suitable therapeutic intervention. These can prevent or slow down disease progression and alleviate the burden of chronic liver disease on patients, caregivers, and healthcare professionals. Additional videos, information, and learnings on multiparametric ultrasound can be accessed online, intended for healthcare professionals only.26