
Abstract
Introduction: Diabetes is a global medical condition associated with a huge human and financial cost. However, early detection and appropriate pharmacological and non-pharmacological interventions, such as structured patient education, are useful measures to reduce its impact. Although the benefits of educational intervention are well recognised as a key component of empowerment, motivating attendance in diabetes education centres remains problematic, and this has a negative impact on healthcare finances.
Objective: This survey study sought to identify the socio-demographic determinants of attendance at diabetes education centres.
Methods: A questionnaire survey of 207 patients from four diabetes education centres was conducted.
Results: In predicting attendance from demographic variables, the regression analysis showed that the participants that were living alone are less likely to attend, while participants who have a flexible working environment are more likely to attend the sessions.
BACKGROUND
People with long-term conditions such as diabetes are at greater risk of comorbidity, and anecdotal evidence suggests that it can increase the burden of ongoing COVID-19 pandemic infection.1-3 Diabetes is characterised by elevated blood glucose levels,4 and consistently high levels of glucose can lead to life threatening complications such as nephropathy, retinopathy, and gangrenous foot ulcers.3 Thus, diabetes has a negative physical, psychological, social, and economic impact on the affected individual.5 Despite significant advancements in diabetes care, there has been a global upsurge in the prevalence of diabetes within the last decade.
The development of structured patient education as a form of therapy has a positive impact on diabetes management, and has tremendously improved the level of awareness, consequently helping to reduce avoidable complications.6 Nevertheless, attendance at diabetes education centres is important to achieve the goal of educational intervention. Evidence indicated that barriers to attendance at diabetes education centres are due to various factors, such as demographic characteristics of the patient and organisation of care.5-7 The individual is unique, with varying socio-demographic characteristics that may either influence or hinder attendance. Although some studies have identified the socio-demographic characteristics of non-attenders, there is little research to discern whether these factors can be used to predict attending behaviour.
RESEARCH DESIGN AND METHODS
A survey of two groups of patients was conducted in four selected hospital sites in the South East of England. These settings were chosen because of the number of attritions from diabetic education sessions and its demographical differences. The research followed the principles outlined in the Declaration of Helsinki, and was conducted according to the ethical codes guiding research in England.8,9 Ethics approval for this study was granted by Berkshire Research Ethics Committee. Similarly, the participant’s consent was sought at the beginning of each data collection stage, with freedom to withdraw at any time.10 The aim of this study was to examine the influence of socio-demographic characteristics on attendance, and to discern whether these factors can be used to predict attending behaviour.
The access to the participants was gained through the general practitioners’ register in the primary care trust, and a purposive sample of 207 newly diagnosed patients with diabetes were surveyed. The criterion for selecting eligible patients was all the recently diagnosed patients who had been referred to diabetes education centres for a structured patient education programme within the last 12 months. The researcher performed a power calculation to determine the required sample size for the questionnaire.11,12 The calculation was based on Cohen’s (1988) effect size guide (correlations: small=0.1; medium=0.3; large=0.5). It was calculated that a total number of 176 participants (n=88 in each group) would be needed to generate a moderate effect size of 0.3 at a power rate of 0.95, which was sufficient for this study.
The instruments were administered to attenders through face-to-face interactions during diabetes education sessions, while postal technique was used for non-attenders and data analysis was carried out in three phases.11,13 In addition to descriptive statistics such as frequency distribution, percentages, cross tabulations, and correlations between variables that are deemed to be important in answering the research questions, Chi-square was used to compare both groups, and therefore show if there were differences between the expected and observed frequencies between the two groups. Finally, logistic regression was used to produce a model that predicts which variables might lead to non-attendance.11,12,14 As the exact p-value will be reported in the text, the α level used as a significance criterion for all the statistical tests is p≤0.05. From a positivist perspective, Statistical Package for the Social Sciences (SPSS) software (IBM, Armonk, New York, USA) was employed to analyse the quantitative data, and the results are presented below.12
SOCIO-DEMOGRAPHIC DATA
Age Distribution of Participants
(Table 1), showing the age distribution of participants, revealed that the age distribution of majority of the participants ranged between 41 years and 65 years (n=137, 66%) and approximately one-fifth (n=39, 19%) were over 66 years of age. There was an equal number of females (n=7) in both groups within the age range of 40 years and below. Of the 31 participants who were under 40 years, n=19 were living alone, while n=7 were living with family. The majority of the middle-aged participants within the age range of 40 years to 65 years were living with a partner. Nevertheless, Chi-square analysis of this data showed no statistically significant association between the age of both groups and attendance behaviour: χ2 (2; N=207): 3.39, p=0.183.
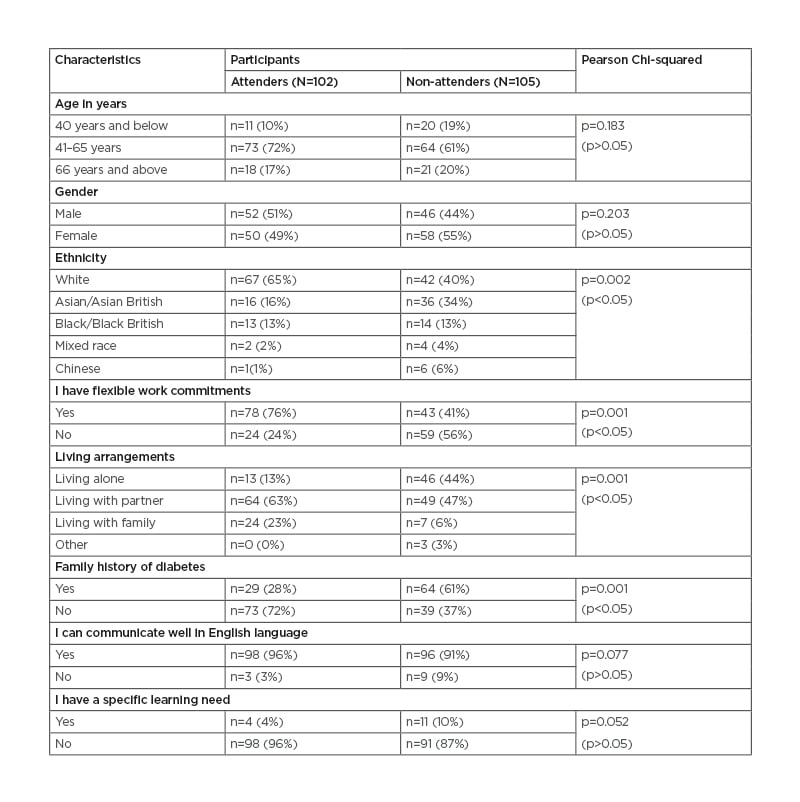
Table 1: Patient socio-demographic data.
Gender of Participants
As shown in Table 1, the gender distribution of both groups is similar. However, there were fewer males (n=10) than females. In all, 42 males were White, 23 were Asian/Asian British, and 20 were Black/Black British, while 66 females were White, 29 were Asian/Asian British, and 7 were Black/Black British. Out of this number, a higher number of males in the non-attenders group (n=21) were living alone as compared to the attenders (n=7). Overall, the data on male/female ratio of the participants in both groups showed no statistically significant association between gender and attendance behaviour: χ2 (1; N=206): 0.94, p=0.203.
Ethnic Origin of Participants
Table 1 shows that slightly more than half (n=109, 53%) of the participants were from a Caucasian background, and a quarter were Asian (n=52, 25%). Other minority ethnic groups constituted less than a quarter (n=41, 20%) of the participants. The majority of the White participants (n=75) did not have a family history of diabetes, while more than half of Asian participants (n=36) had a history of diabetes in their family. The data revealed that more White participants among the attenders (n=54) have flexible working commitments as opposed to the non-attenders (n=19). The Pearson Chi-square analysis of this data indicated an association that achieved statistical significance between attendance behaviour and ethnicity: χ2 (5; N=202): 18.68, p=0.002.
Type of Working Environment of the Participants
From the data in Table 1, 24 (24%) of the participants who attended the session had an inflexible work environment whilst more than three-quarters (n=78, 76%) had a flexible work environment. Against this figure, the data for non-attenders revealed that more than half of them (n=59, 56%) did not have a flexible working environment and (n=43, 41%) did, whilst (n=3, 3%) did not answer the question. Unlike the non-attenders with a close margin, the margin between those that had flexible working environments (76%) and those that did not have flexible working environments (24%) amongst the attenders is very wide. This data shows an association that is statistically significant between working commitments and attendance behaviour: χ2 (1; N=204): 24.88, p=0.001.
Living Arrangements of the Participants
The living arrangements of participants who attended the session revealed that almost two-thirds (63%) were living with a partner while less than half (47%) of non-attenders were living with a partner. On the other hand, a greater number of non-attenders were living alone n=46 (44%) as opposed to n=13 (13%) amongst the attenders. The overall data showed that more participants who were living with a partner (n=112) or living with a family (n=30) had a flexible work environment as compared to those living alone (n=59). An association that achieved statistical significance was observed between the living arrangements and attendance between the two groups: χ2 (3; N=206): 32.71, p=0.001, as shown in Table 1.
Family History of Diabetes amongst Participants
More attenders did not have a family history of diabetes, while almost two-thirds of non-attenders (n=64, 61%) had a history of diabetes in their family (Table 1). Although more than half of the total number of participants had no family history of diabetes (n=112, 54%), the majority of them were attenders (n=73, 65%), showing a statistically significant association between family history and attendance behaviour between the two groups: χ2 (1; N=205): 23.49, p=0.001.
Level of Communication of the Participants
As shown in Table 1, only a minority of participants have problems with speaking English. Out of this minority (n=12), the number of non-attenders (n=9) who could not communicate well in the English language was triple in the number of attenders (n=3). This study found no statistically significant association between communication and attendance behaviour: χ2 (1; N=206): 2.94, p=0.077, as the majority of both groups can communicate well in the English language.
Learning Requirements of Participants
The question on socio-economic data presented in Table 1 showed that an overwhelming number of both groups had no specific learning needs (n=189, 91%), which unsurprisingly revealed no statistically significant association between learning needs and attendance behaviour: χ2 (1; N=204): 3.53, p=0.052. Out of 15 participants who had a specific learning need, n=9 were female and n=6 were male.
ANALYSIS OF FINDINGS
A total of 207 participants completed the questionnaire, and the sample comprised 102 participants who attended the sessions and 105 participants who did not attend. Table 1 shows a breakdown of the socio-demographic characteristics of the participants. The majority of both attenders and non-attenders fell between the age range of 41 years and 65 years (73 versus 64; p>0.05) and this reflects the epidemiology of Type 2 diabetes mellitus.15,16 Differences in ethnicity were observed for non-attenders versus attenders17 (Caucasian: 67 versus 42; Asian 16 versus 36; p<0.05) while the gender distribution of both groups was similar (p>0.05). A significantly higher percentage of attenders had a flexible work environment (78 versus 43; p<0.05) and more non-attenders were living alone (46 versus 13; p<0.05), while more attenders did not have a family history of diabetes6 (73 versus 39; p<0.05). Data from the study revealed no significant differences in their level of communication and specific learning needs (p>0.05).
The series of Chi-square tests of association between attending behaviour and the various socio-demographic variables identified four variables that showed statistically significant associations; therefore, logistic regression was performed on: ethnicity, living arrangements, family history of diabetes, and flexibility of working environment (Table 2). The results in Table 2 show that living arrangements (p<0.001), employment (p<0.001), and family history of diabetes (p=0.05) added to the prediction, while ethnicity (p>0.05) did not add significantly to the model. The category ‘living arrangements 1’ (living with family) is a significant predictor of attendance (p=0.004) and the odds ratio is 3.33. This indicates that the participants who were living with family are three-times more likely to attend.12 Equally, the category ‘living arrangements 2’ (living with partner) is also a significant predictor (p=0.001) and the odds ratio is 16.35, denoting that participants who were living with partners are 16-times more likely to attend the session than those who do not. However, category ‘living arrangements 3’ (living alone) is not a significant predictor (p=0.999). Employment is also a significant predictor (p=0.001), and the odds ratio is 4.38. This shows that participants who have a flexible working environment are four-times more likely to attend the sessions.12 The logistic regression showed that ethnicity and family history of diabetes were not significant predictors of attendance.
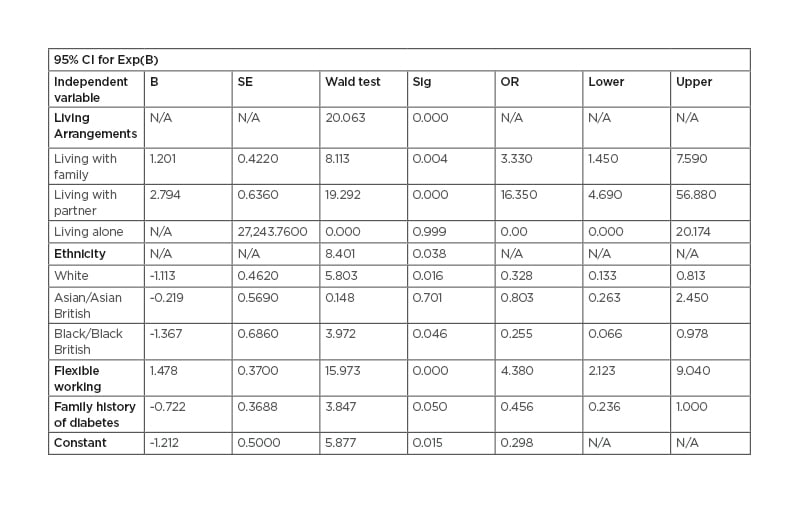
Table 2: Logistic regression analysis of demographic data of the participants (N=207).
Model x2=78.19, p<0.001.
Pseudo R2=0.43 (Nagelkerke R-square). B: coefficient for the constant; CI: confidence interval; Exp(B): exponentiation of the B coefficient; N/A: not applicable; OR: odds ratio; SE: standard error.
DISCUSSION
There were similarities in age and gender with variations in living arrangements, ethnicity, employment, and family history of diabetes. The findings showed a wide ethnic variation between the two groups of patients within the four localities, and this reflects Britain’s multi-cultural society.18,19 It is reasonable to assume that ethnicity is going to be a predictor of attendance; however, ethnicity was not a significant predictor in this sample (p>0.05), with an odds ratio of less than 1. Different cultural backgrounds have different expectations, and there is a link between culture and perception to healthcare utilisation;20 therefore, this finding is surprising. However, in addition to English language sessions, the provision of education in an area of the Trust with a high ethnic minority covers a separate session in another language (Punjabi). The findings suggest that communication and learning needs was not a significant barrier in this sample, and this contradicts the studies of Rhee et al.21 and Graziani et al.,22 which revealed that a low level of education and an inability to read well constitute a significant obstacle to attendance. It is important to establish that both studies were conducted outside the UK, and it could be partly due to availability of education sessions in some other languages.
The model suggested that, although three socio-demographic variables have value in predicting attendance behaviour, the two key predictors for the sample in this study are living arrangements and working environment. This finding is compatible with Hsu and Gallinagh,23 who found that living alone was associated with a low uptake, but found no association between attendance and age. Similarly, several authors have identified work and a family history of diabetes as barriers to attendance,7,22,24-26, and this is congruent with the findings of this study. Whilst family history of diabetes achieved significance (p=0.05) in this study, the odds ratio was low; however, it does merit further research in the future in terms of its predictive ability.12 Evidence from epidemiological studies27-29 is increasingly suggesting a link between socio-demographical characteristics of the patient and compliance to healthcare interventions. Changing behaviour is a complex process;5,30 therefore, the authors’ study suggested the need to recognise the impact of socio-demographical factors as an important modifier in the change process.
LIMITATIONS OF THE STUDY
The use of purposive sampling technique and small sample size of participants in the current study suggest that it cannot be generalised to non-attenders in clinical settings in the UK. With a response rate of 25.8% among the non-attenders after three repeated follow-up questionnaires, there is a possibility that valuable information could have been missed from those that have decided not to participate in the study. Additionally, there may be a self-report bias. These limitations of survey study are well documented in literature;14,31 however, this research has thrown more light on this phenomenon of non-attendance in diabetes education centres.
SUMMARY
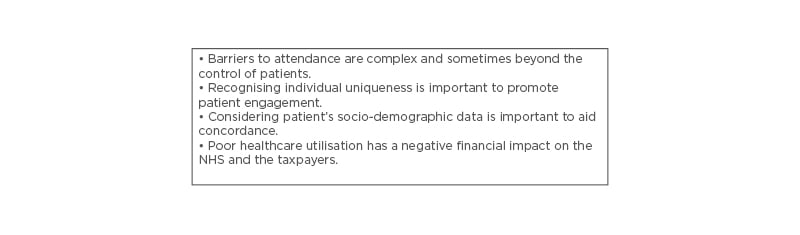
Although both the national and international response to diabetes prevention and management includes empowerment, it has always been challenged by the number of wasted appointments. This study has contributed to the body of knowledge on non-attendance in clinical practice and the findings confirm the importance of considering demographic characteristics when providing educational intervention (Box 1). Thus, expanding the understanding of these factors is crucial for healthcare providers and educators to identify additional support that the patients may require when devising healthcare interventions. In all, the implications of this result should be interpreted within the context of the limitations of the project. Additionally, the authors recommend conducting a further large-scale study covering several hospital trusts across the country.
Box 1: Implications for practice.
NHS: National Health Service.