Abstract
Background: The neutrophil-to-lymphocyte ratio (NLR) is a simple and inexpensive examination that is considered to show inflammation. In this study, which included a control group, the authors aimed to investigate if there was a relationship between glycaemic regulation parameters and NLR in patients with Type 2 diabetes mellitus.
Material and Methods: A total of 278 Type 2 diabetic patients were included in the study. An additional total of 148 healthy people were also included as a control group. NLR was calculated by dividing the absolute neutrophil number by the absolute lymphocyte number. The patients were divided into two groups: the good glycaemic control group (HbA1c ≤7.5%) and the poor glycaemic control group (HbA1c >7.5%). NLR was compared between the diabetic groups. In addition, NLR was compared with diabetic patients and control group.
Results: The NLR was statistically and significantly higher in the poor glycaemic control group compared to the good glycaemic control group (2.48 [1.97–2.60] to 2.07 [1.72–2.40], respectively; p=0.020). In addition, NLR was significantly higher in the patients than in the control group (2.30 [2.04–2.49] to 2.01 [1.85–2.18], respectively; p=0.002).
Conclusion: According to the authors’ knowledge, increased NLR may be associated with poor glycaemic control in Type 2 diabetic patients. NLR may be useful used as an easily measurable, noninvasive, available, and cost-effective parameter for the follow-up of diabetic patients.
INTRODUCTION
Diabetes mellitus (DM) is an important public health problem with a gradually increasing prevalence in the authors’ country and worldwide. In Turkey, the prevalence of DM was 7.2% in the TURDEP 1 study conducted in 1998.¹ This ratio increased to 13.7% by showing an increment of 90% after 12 years in 2010.1,2 The National Cholesterol Education Program-Adult Treatment Panel 3 (NCEP-ATP3) recommends that DM should be accepted as a coronary artery disease equivalent because of its complications and close association with cardiovascular diseases.3 In recent years, studies have supported the thesis that even prediabetes might be a coronary artery equivalent.4
The association between DM and atherosclerosis has been demonstrated clearly in many studies. It is also known that many complications of DM occur in the atherosclerotic background. Systemic inflammation is a risk factor for atherosclerosis and can be evaluated with many different biomarkers, including high-sensitive C-reactive protein and IL-6, TNF-α, fibrinogen, p-selectin, and serum amyloid A.5-8
The neutrophil-to-lymphocyte ratio (NLR) has become a popular inflammation marker recently, and studies have supported that a high NLR negatively affects the frequency and prognosis of coronary artery disease.9 In a study performed by Sonmez et al.,10 a close relation was found between high NLR and presence and complexity of coronary artery disease. The relation between DM and NLR has also become a current issue of investigation recently.
In this study, which had a control group, the authors aimed to investigate the relationship between glycaemic regulation parameters and NLR in patients with Type 2 DM (T2DM) and determine how NLR was affected by the changes in HbA1c.
MATERIALS AND METHODS
Patient Selection
In the study, 278 T2DM patients who were being followed up in the authors’ outpatient clinic and consecutively presented for follow-up visits between March 1 and June 30, 2017, were included. A total of 148 people admitted to the health committee for a certificate of health were included as the control group. Patients with T1DM, aged <18 years and >65 years, who were pregnant, had evidence of active infection, history of chronic disease other than DM, respiratory failure, coronary artery disease, or cerebrovascular disease were not included in the study. The patients were divided into two groups: the good glycaemic control group (HbA1c ≤7.5%) and the poor glycaemic control group (HbA1c >7.5%). HbA1c, glucose, and haemogram values of some patients after 3 months could be reached and the effect of glycaemic regulation parameters on NLR was investigated in these patients.
Laboratory Tests
Blood samples of the patients were obtained in the morning between 8:00am and 10:00am after a fasting period of at least 8 hours. The blood samples of all patients obtained for complete blood count, fasting plasma glucose, and HbA1c were studied.
For complete blood count, 2 mL of blood was placed in EDTA K3 tubes and the samples were studied for 1 hour using a flow cytometric method by Sysmex XT-2000i (Roche). NLR of the patients was calculated by dividing the absolute neutrophil number by the absolute lymphocyte number. HbA1c levels were measured using the Boronat affinity method by Trinity Biotech Premier HB9210 device (Trinity Biotech plc). Fasting plasma glucose was measured using hexokinase method (enzymatic ultraviolet method) by Beckman Coulter Olympus AU 2700 device (Beckman Coulter®).
Statistical Method
Chi-square test was used in the comparison of the categorical data of the two groups divided by HbA1c levels. Compliance with the normal distribution of numerical variables were controlled by Kolmogorov–Smirnov test. The Mann–Whitney U test was used to compare NLR, glucose, and HbA1c. Wilcoxon signed-ranks test was used to compare the NLR of the patients whose HbA1c, glucose, and haemogram values 3 months after treatment modification could be reached. Statistical evaluation was performed by SPSS 17.0 program (IBM).
RESULTS
A total of 278 patients (female n=180, 64.7%) were included in the study. The median age of the study group was calculated to be 49 (45–51) years. A total of 45.9% of the diabetic population had hypertension, 42.4% had hyperlipidaemia (low-density lipoprotein target of ≥100 mg/dL), 41.9% of the population had obesity (BMI of ≥30), 26.6% had diabetic nephropathy, 18.8% had coronary artery disease, 12.5% had retinopathy, and 3.7% had cerebrovascular disease.
The NLR was significantly higher in patients than in the control group (2.30 [2.04–2.49] to 2.01 [1.85–2.18], respectively; p=0.002). A total of 43.9% of the patients (n=122) were in the good glycaemic control group (HbA1c ≤7.5%) and 56.1% (n=156) were in the poor glycaemic control group (HbA1c >7.5%). The good glycaemic control group, poor glycaemic control group, and healthy control group were similar in terms of age and gender distribution (p=0.7 and p=0.9, respectively). The median HbA1c value was 6.7% (6.0–7.1%), the median fasting glucose was 110 mg/dL (95–127 mg/dL), and the median NLR was 2.07 (1.72–2.40) in the good glycaemic control group. In the poor glycaemic control group, the median HbA1c value was 10.1% (8.2–11.0%), the median fasting glucose was 225 mg/dL (182–270 mg/dL), and the median NLR was 2.48 (1.97–2.60). A significant difference was found between the two groups in terms of HbA1c, fasting plasma glucose, and NLR (p<0.001, p<0.001, and p=0.02, respectively). In the healthy control group, the median HbA1c value was 5.6% (5.5–5.9%), the median fasting glucose was 89 mg/dL (78–100 mg/dL), and the median NLR was 2.01 (1.85–2.18). There were no significant differences between the three groups in terms of median leukocyte, neutrophil, and lymphocyte counts (p=0.6, p=0.6, and p=0.3, respectively). Comparison of the demographic properties, glycaemic regulation parameters, and NLR values of the patients is shown in Table 1]/hl]. The glycaemic regulation parameters and NLR values of 278 patients who were studied in the authors’ outpatient clinic at 3-month intervals were also evaluated.
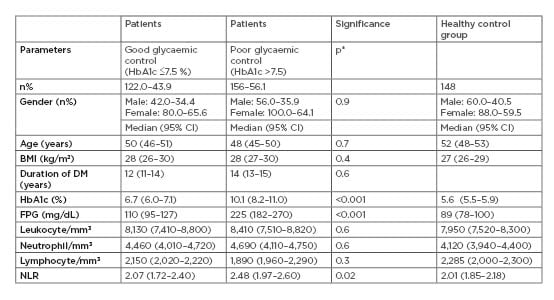
Table 1: Comparison of the demographic data of the patients and the groups.
CI: confidence interval; DM: diabetes mellitus; FPG: fasting plasma glucose; HbA1c: haemoglobin A1c; NLR: neutrophil-to-lymphocyte ratio; p*: comparison of patient groups.
In these 68 patients, the median HbA1c value was 9.3% (8.1–10.1%), the median fasting plasma glucose was 198 mg/dL (149–248 mg/dL), the median number of leukocytes was 7,920/mm3 (7,200–8,440/mm3), the median number of neutrophils was 4,350/mm3 (4,090–4,710/mm3), the median number of lymphocytes was 1,840/mm3 (1,750–2,050/mm3), and the median NLR value was 2.36 (1.90–2.70) in the first evaluation. In the second evaluation in the outpatient clinic, the median values after 3 months were 7.6% (7.0–8.2%) for HbA1c, 157 mg/dL (128–189 mg/dL) for fasting plasma glucose, 7,810 mm3 (7,150–8,410/mm3) for number of leukocytes, 4,020/mm3 (3,850–4,520/mm3) for number of neutrophils, 2,220/mm3 (2,010–2,280/mm3) for number of lymphocytes, and 1.81 (1.63–2.10) for NLR. A significant difference was found between the HbA1c, fasting plasma glucose, and NLR values between two data points in the patients for whom the values belonging to these 2 months could be found (p<0.001, p<0.001, and p=0.001, respectively). There were no differences in the number of leukocytes, neutrophils, and lymphocytes in both groups (p=0.9, p=0.4, and p=0.1, respectively). Table 2 compares the HbA1c, fasting plasma glucose, leukocyte, neutrophil, lymphocyte, and NLR values of 68 patients whose records belonging to both measurements could be accessed.
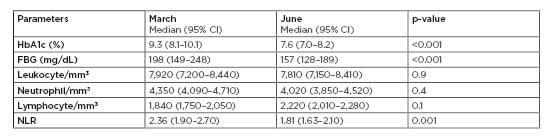
Table 2: Comparison of the glycaemic regulation parameters and neutrophil-to-lymphocyte ratio values belonging to March and June (quarterly).
CI: confidence interval; FBG: fasting blood glucose; HbA1c: haemoglobin A1c; NLR: neutrophil-to-lymphocyte ratio.
DISCUSSION
This study is important in demonstrating the relationship between glycaemic parameters and NLR. Recently, many studies related with NLR have been conducted because it is a practically calculable method. Binnetoglu et al.11 investigated the relation between NLR and proteinuria in patients with chronic renal failure without a diagnosis of DM and consequently found an increase in the frequency and severity of proteinuria as NLR increased. In a study performed by Tanindi et al.12 including 151 patients, a higher NLR value was found in the patients in whom angiography was performed because of acute myocardial infarction compared to the patients in whom angiography was performed because of stable angina.
Lee et al.13 investigated the relation of NLR with long-term complications following myocardial infarction in 2,559 consecutive acute myocardial infarction patients and found that NLR was an independent risk factor for long-term complications in diabetic patients. Yilmaz et al.,14 who investigated the benefit of NLR in the diagnosis of gestational DM, found a higher NLR value in pregnant women with gestational DM compared to pregnant women without gestational DM, and found that a NLR value >2.93 had a sensitivity of 76% and a specificity of 94% for gestational DM. Shiny et al.15 examined the relation between glucose intolerance and NLR. Conclusively, they found a higher NLR value in patients with a diagnosis of DM compared to the patients with impaired fasting glucose, and in patients with impaired fasting glucose compared to normal individuals. In another study, increased NLR in diabetic individuals was reported to be a risk factor for sensorineural hearing loss.16
The relation between diabetic complications and NLR was examined in the study performed by Ulu et al.17 A significant relation was found between increased NLR and the severity of retinopathy. In geriatric diabetic patients, the relation between microvascular complications and NLR was investigated and an increase in the prevalence of microvascular complications was found with increased NLR.18 A close relation was found between NLR and urinary albumin and protein excretion in newly diagnosed T2DM patients.19 A higher NLR was found in nondipper hypertension, which shows a close association with DM and insulin resistance compared to dipper hypertension.20 Xu T et al.21 showed that NLR is significantly correlated with diabetic polyneuropathy, which suggested that NLR may be an independent risk factor of diabetic neuropathy.
The NLR was significantly higher in the poorly controlled DM group compared to the well-controlled DM group in the study performed by Sefil et al.,22 which reported results that were similar to those found in this present study. The difference of this study from the study performed by Sefil et al.22 was the fact that the mean NLR value was also reduced in the patients in whom glycaemic parameters improved 3 months later. Hussain et al.23 reported similar results between NLR and glycaemic regulation. They found a significant association between NLR and HbA1c among the groups divided into three according to the glycaemic control status. In this study, NLR values after treatment were not investigated.
In a prospective study by Guo X et al.24 on a nondiabetic 38,074-strong cohort, an average of 6-year follow-up NLR was associated with the incidence and prevalence of T2DM. This result suggests that the NLR is a predictor for the development of diabetes.
In this study, there was a significant relationship between NLR and glycaemic regulation with both diabetic groups when compared to the control group. This result suggests that NLR changes from the early stages of diabetes. The study by Lou M et al.25 supported this study and showed a relationship between insulin resistance and NLR in newly diagnosed diabetics.
Contrary to the present authors’ research, Mendes et al.26 showed that hyperglycaemic subjects had a NLR similar to that of normoglycaemic subjects, but had a lower platelet-to-lymphocyte ratio. However, most of the studies in the literature support this present study.
As in the current international guidelines, the national guideline is targeted at 7% below HbA1c for T1DM, pregnancy, and uncomplicated T2DM. However, in patients with complications, especially in patients with cardiovascular and neurological comorbidities and in the elderly population, it is recommended to be around 8% for HbA1c targets.27,28 Because the patient population was not a homogenous group, HBA1c target was taken as 7.5%. It is well known that impaired glycaemic control initiates an inflammatory process and is associated with diabetic complications.
The limitations of the study included failure to reach the complication states of the patients, the lack of knowledge about the therapies used, and the changes made as a result of outpatient evaluation.
CONCLUSION
In diabetic patients, NLR deterioration is associated with glycaemic disorder, which increases the importance of haemogram in diabetic patients. In cases in which HbA1c measurement cannot be performed, and if the glycaemic condition is not evaluated earlier, NLR can be a useful examination. Improvement of NLR after glycaemic regulation has suggested that this parameter may be more useful in demonstrating glycaemic regulation rather than complications.
NLR may be useful as an easily measurable, noninvasive, available, and cost-effective parameter for the follow-up of diabetic patients. Larger-scale, randomised, controlled studies should be performed in this area.