Abstract
Background: Diabetes is a global pandemic. Mean platelet volume (MPV) is an indicator of increased platelet activity, which is considered to play a role in the development of vascular complications in diabetes. Platelet volume is strongly and independently related with glycaemic control in Type 2 diabetes (T2D).
Aim: To study the MPV in patients with T2D, and its correlation with HbA1c, duration of T2D, and microvascular complications.
Methodology: This was a cross-sectional, observational study conducted at the Department of Medicine, Gandhi Medical College, Bhopal, India, during a period of 18 months on 300 patients with T2D. Blood glucose, HbA1c, MPV, fundoscopy, and 24-hour urine protein were done. Data were represented as mean+/-standard deviation and statistical analysis was done using SPSS software (IBM, Armonk, New York, USA).
Results: The mean age of patients was 56.64±8.69 years, with 52% of the patients being females. Of these patients, 18.3% had HbA1c between 6.5–8.0%, 51.7% between 8.1–10.0% and the rest above 10.0%. A total of 51% of the patients had diabetes for 6–10 years of duration and 30% for more than 10 years. Patients with higher HbA1c level and prolonged duration of diabetes had higher MPV (p<0.001). Patients with advanced diabetic retinopathy changes and nephropathy also had higher MPV (p<0.05).
Conclusion: Measurement of MPV in patients with T2D can be a useful and easily available prognostic marker, and hence assist clinicians to anticipate the occurrence of microvascular complications associated with the disease, especially in resource-poor settings, and reduce the burden of cost for the patient.
Key Points
1. Mean platelet volume (MPV) in Type 2 diabetes (T2D) is an indicator of poor glycaemic control. MPV is available as a part of the complete blood count report and, therefore, can be used to help indicate the occurrence of diabetes-related complications, which is especially useful in resource-limited settings.
2. This cross-sectional, observational study evaluated MPV as an indicator of glycaemic control in patients with T2D. The findings revealed a positive correlation between MPV and HbA1c, and MPV and microvascular complications, including diabetic nephropathy and retinopathy.
3. MPV is an accessible biomarker that can be used in clinical practice to assess glycaemic control in patients with T2D, help clinicians predict morbidity and mortality, and allow for earlier interventions to reduce the risk of developing associated microvascular complications.
INTRODUCTION
Diabetes is emerging as an epidemic worldwide and is a global public health problem. The International Diabetes Federation (IDF) has predicted that 463 million individuals had diabetes in the year 2019, and this figure is projected to increase to 578 million by the year 2030, and 700 million by the year 2045.1 Diabetes affects 77 million adults in India, making it the country with the second highest prevalence of the disease worldwide. Prevalence of diabetes is highest among adults between the ages of 50–70 years old, compared with all other age categories. With an estimated 1 million fatalities a year attributed to diabetes and its associated complications, India was the country that had the greatest impact on the overall diabetes mortality rate.1
Type 2 diabetes (T2D) is the most prevalent form of the disease, accounting for approximately 90% of diabetes cases globally. Hyperglycaemia defines T2D, which is characterised by insulin resistance. Whenever a person has insulin resistance, the hormone is rendered ineffective, which, in due time, causes an increase in insulin production. Because the pancreatic β-cells are not able to keep up with the demand for insulin over time, an inadequate amount of insulin production might develop. Most people who develop T2D are adults in their later years; however, the disease is becoming more prevalent in children and younger adults as a result of rising rates of obesity, physical inactivity, and improper diet.2
Patients with diabetes have been found to have altered platelet morphology and function, and the mean platelet volume (MPV) has been found to be significantly higher in patients with diabetes compared with the normal population.3,4 Individuals with uncontrolled hyperglycaemia and longer duration of diabetes are more prone to develop diabetic microvascular problems.5
Diabetes is associated with an increased risk of microvascular complications, and the increase in platelet size may be one component that contributes to this increased risk. As a result, MPV has the potential to serve as a valuable predictor of vascular problems in diabetes. It is believed that osmotic swelling as a result of hyperglycaemia is the cause of greater MPV in people with diabetes, despite the fact that the underlying mechanism responsible for this is not yet fully known.6 Alternately, a larger platelet size could indicate the existence of a high platelet turnover rate as well as younger platelets, which will reflect as higher MPV.7 The link between MPV and diabetes was clearest in those individuals who had the least control of their glucose levels.8 As a result, the purpose of the current study was to investigate the impact of HbA1c on platelet activity as measured by MPV, as well as the correlation of MPV with glucose control, duration of diabetes, and microvascular complications.
METHODOLOGY
The present study was conducted as a cross-sectional, observational study in the Department of Medicine, Gandhi Medical College and associated Hamidia Hospital, Bhopal, India, during the study period of 18 months (from January 2021–June 2022). All the patients diagnosed as per American Diabetes Association (ADA) criteria, over 18 years, with HbA1c >6.5%, fasting plasma glucose >126 mg/dL, post-2 hour blood glucose (after 75 g glucose) >200 mg/dL, and random blood glucose >200 mg/dL were included. Individuals with abnormal platelet count <1.5 lacs/µL or >4 lacs/µL; with known bleeding/clotting disorders; taking drugs affecting platelet function like antiplatelet drugs, statins, anti-coagulants, etc.; with chronic liver disease; any malignancy; and pregnant females were excluded from the study.
The study was initiated after obtaining ethical clearance from the Institute’s ethical committee. A total of 300 cases were enrolled. All the patients were then subjected to detailed history and clinical examination. Plasma glucose levels were calculated using glucose oxidase method, and HbA1c using high performance liquid chromatography. MPV was measured using automated haematology blood counter from Mindray (Mindray Global, Shenzhen, China). Based on the HbA1c levels, patients were categorised in three groups: 6.5–8.0%, 8.1–10.0%, and >10.0%. Fundoscopy was done to look for retinopathy. Apart from this, urine routine microscopy and 24-hour urine protein was also done to look for nephropathy.
STATISTICAL ANALYSIS
Data was recorded in Microsoft Excel (Microsoft, Redmond, Washington, USA) and statistical analysis was performed by the SPSS program for Windows, version 25 (IBM, Armonk, New York, USA). Continuous variables were presented as mean±standard deviation, and categorical variables were presented as absolute numbers and percentage. Categorical variables were analysed using either the χ2 test or Fisher’s exact test. Continuous variables were assessed using analysis of variance or independent sample t-test. Pearson correlation (r) was performed to establish the correlation between different parameters. P<0.05 was considered statistically significant.
RESULTS
The study was conducted on a total of 300 patients with T2D with a mean age of 56.6±8.6 years.
The majority of patients with T2D belonged to age group 51–60 years (47%), followed by 61–70 years (22.7%). Approximately 52% were females and 50.3% of the participants had hypertension. The majority (68%) of the participants had BMI between 18.5–24.9 kg/m2 and mean BMI was 21.79 kg/m2. The majority of the patients with T2D had HbA1c between 8.1–10.0% (51.7%) and 30.0% of the patients had HbA1c above 10.0% (Table 1).
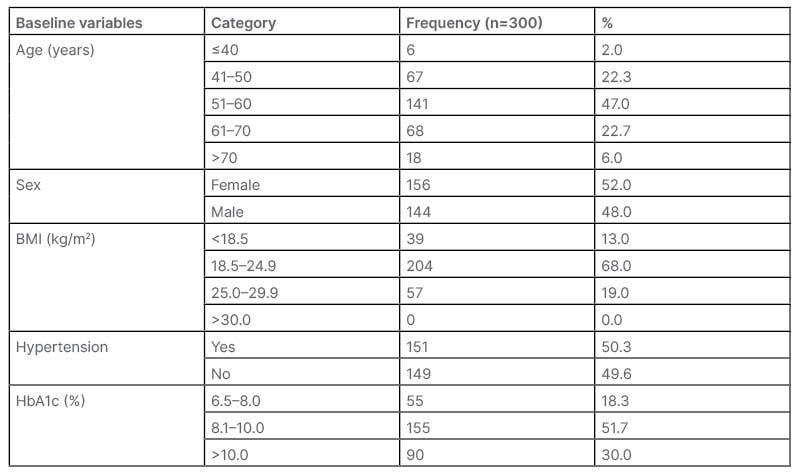
Table 1: Distribution of cases according to baseline variables.
On comparing the MPV level with the glycaemic control, it was revealed that those with higher HbA1c level had higher MPV (p<0.001). Similarly, MPV was significantly higher in patients with prolonged duration of diabetes (p<0.050; Table 2).
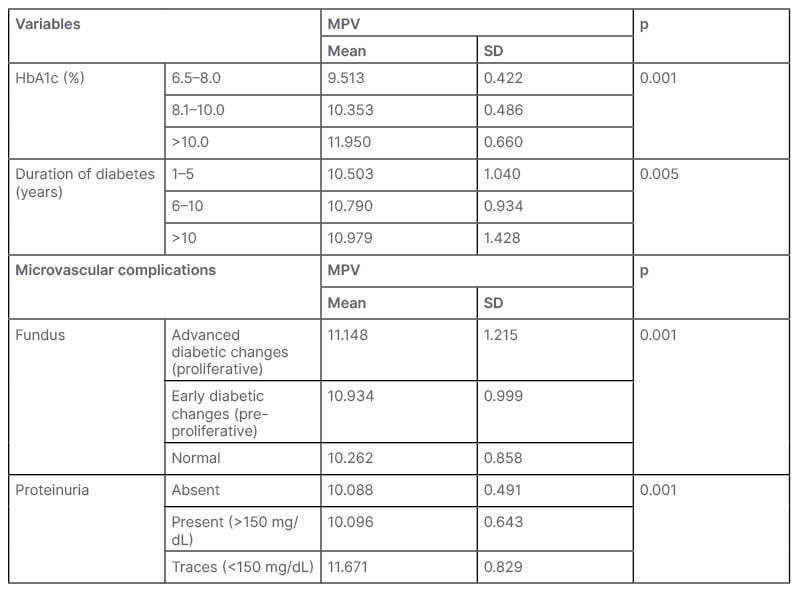
Table 2: Association of mean platelet volume with glycaemic control, duration of diabetes, and microvascular complications.
HbA1c: haemoglobin A1c; MPV: mean platelet volume; SD: standard deviation.
On comparing diabetes duration among HbA1c category for MPV, it was observed that patients with diabetes duration between 1–5 years, and HbA1c level >10 had higher MPV than the lower HbA1c values. A similar trend was observed for 6–10 and >10 years of diabetes duration where MPV increased with increasing HbA1c level (p<0.05). However, there was no significant difference in MPV in different duration of diabetes with similar HbA1c.
In the authors’ study, patients with advanced diabetic retinopathy and with significant proteinuria (nephropathy) had higher MPV than those with early diabetic changes and those with <150 mg/dL proteinuria (p<0.05; Table 3).
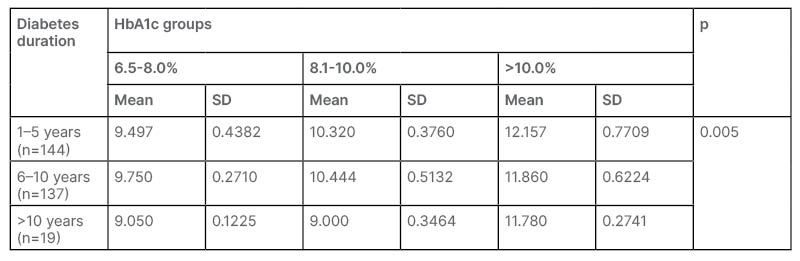
Table 3: Comparing diabetes duration among HbA1c category for mean platelet volume.
HbA1c: haemoglobin A1c; MPV: mean platelet volume; SD: standard deviation.
Pearson correlation revealed a significant positive correlation of fasting blood sugar (r=0.804), postprandial blood sugar (r=0.745), random blood sugar (r=0.799), HbA1c (r=0.860), duration of diabetes (r=0.174), proteinuria (r=0.651), and abnormal fundus findings (r=0.335) with MPV (p<0.05).
DISCUSSION
MPV is an efficient, easily available, and cost-effective marker, which can be used in monitoring glycaemic status in patients with T2D.
This was an observational study on 300 patients with diabetes with mean age of 56.64±8.69 years. The majority of individuals in this study who had T2D had HbA1c that ranged between 8.1–10.0% (51.7%). When the MPV level was compared with the glycaemic control, it was discovered that those with a higher HbA1c level had a greater MPV (p<0.001). This provides evidence that an increasing MPV can be a sign of poor glycaemic control.
Swaminathan et al.9 also discovered that the difference between the MPV in patients with diabetes and without diabetes was statistically significant. In patients with diabetes, the MPV was found to be 10.200±0.770, whereas in those without diabetes, the MPV was 9.816±0.400. According to Kodiatte et al.,10 the mean HbA1c level in the diabetes group was 9.130±2.530%, while the level in the non-diabetic group was 5.950±0.723% (p<0.001). MPV was significantly greater in the patients with diabetes (8.290±0.735 fL) compared with the non-diabetic group (7.470±0.726 fL), which was statistically significant (p<0.001).
Saluja et al.11 reported that among the subjects with diabetes, a positive statistical Pearson correlation was seen between MPV and HbA1c levels and fasting blood sugar levels.11
In the current study, increased duration of diabetes also correlated with increasing MPV. Also in the same group of duration MPV showed a positive correlation with increasing HbA1c. For duration of 1–5 years, 6–10 years, and >10 years, the MPV increased with increasing HbA1c levels. Patients with durations ranging from 1–5 years, 6–10 years, and >10 years had respective MPV values of 10.503±1.040, 10.790±0.934, and 10.979±1.428. It can be seen here that there is a statistically significant upward trend in the proportion of MPV with increasing duration of diabetes. Platelet parameters between people with diabetes with diabetic duration <10 years and those with diabetic duration >10 years showed that MPV was significantly increased in people with diabetes with duration of disease >10 years, as reported by Swaminathan et al.9 in their study. However, in the study by Kodiatte et al.,10 they came to the conclusion that there was no correlation between MPV and the length of diabetes, or the existence of complications. It was stated by Saluja et al.11 that the mean HbA1c in patients who had diabetes for more than 5 years was 8.62±0.96, while among patients who had diabetes for less than 5 years it was 8.51±1.09 (p=0.49). According to the findings of Saluja et al.,11 there is not a statistically significant link between MPV and the length of diabetes (p=0.50).
In the current study, an independent association between the risk of microvascular problems and the MPV was found in patients with T2D. When the MPV level was compared with the presence of proteinuria (which is suggestive of diabetic nephropathy), it was found that those with the presence of proteinuria had a higher MPV than those without proteinuria. On the other hand, the MPV was significantly higher in the group that contained less than 150 mg/dL of protein (MPV: 11.670), in contrast to the group that had more than 150 mg/dL of protein (MPV: 10.096), which suggested that MPV did not increase with increase in proteinuria.
In the current study, the MPV was found to be significantly higher in the group that had advanced diabetic retinopathy (11.148), compared with the group that had early diabetic changes (10.934). This difference was statistically significant (p<0.001), which also suggested a positive correlation between MPV and diabetic retinopathy. Saluja et al.11 reported that the MPV in subjects with complications (13.12±1.40 fL) was higher than the MPV in subjects without complications (12.80±1.21 fL), despite the fact that an independent student t-test did not show any statistical significance (p=0.13).
CONCLUSION
Patients with diabetes who have higher HbA1c have higher values of MPV compared with those who have lower HbA1c, which is a marker for diabetes control. Also, MPV correlates positively with duration of diabetes and with presence of microvascular complications in the authors’ study. Hence, the measurement of MPV in patients with T2D can be a good marker of control of diabetes and of probability of microvascular complications. Therefore, it can assist clinicians to anticipate morbidity and mortality associated with the disease. As MPV is widely available as a part of the complete blood count report, it can be easily used, especially in resource-limited settings.
LIMITATION
Absence of a healthy control group is a limitation of the study. Macrovascular complications were not taken into consideration as most patients with cardiovascular diseases were on antiplatelets, which would alter the MPV values and hence they were excluded from the study.