Interviewees: Antonio Berruezo,¹ Francis E. Marchlinski²
1. Heart Institute, Teknon Medical Center, Barcelona, Spain
2. Perelman Center for Advanced Medicine, Philadelphia, Pennsylvania, USA
Disclosure: Berruezo is a stockholder at ADAS3D Medical; a speaker for Bureau/Biosense Webster; a consultant for Biotronik; and holds research sponsorship grants with Circle Cardiovascular Imaging, Biosense Webster, and Biotronik. Marchlinski is a consultant with Biosense Webster, Boston Scientific/Guidant, GE Healthcare, Medtronic, and St Jude Medical; and has research grants with Biosense Webster, Biotronik, Boston Scientific/Guidant, Medtronic, and St Jude Medical.
Acknowledgements: Medical writing assistance was provided by Amanda Barrell, Brighton, UK.
Support: This feature publication was funded with a grant from Circle Cardiovascular Imaging. The opinions expressed in this article belong solely to the named interviewees.
Citation: EMJ. 2021;6[3]:27-32.
Interview Summary
The 12-lead ECG has long played the leading role in identifying the region of the heart responsible for tachycardia to aid in the diagnosis of cardiac arrhythmias and the planning of ablation procedures. However, the approach is not without its limitations.
ECG often struggles to give an accurate picture of where ablation should be targeted, has poor spatial resolution, and low sensitivity in terms of determining the extent of damaged myocardium. For many years, electrophysiologists have combined the ECG with invasive catheter electroanatomic mapping to obtain a more detailed picture of the location of arrhythmia. In recent years, physicians have combined these tools with non-invasive MRI and CT imaging, which provide black and white DICOM cardiac images, in a bid to gain a better understanding of the underlying anatomy, pathology, and fibrosis. This will ultimately enable more accurate pre-procedure planning.
Now, advanced imaging solutions promise to take this complementary approach to the next level. By providing teams with a colour-mapped 3D image of all the fibrotic abnormalities within the heart, this new paradigm has the potential to cut complications, boost patient outcomes, and make workflows more efficient.
Despite the growing body of evidence for the advantages of this complementary approach and its inclusion in the 2019 Expert Consensus Statement on Catheter Ablation of Ventricular Arrhythmias, adoption has been slow. Radiologists and electrophysiologists cite concerns around patient safety, a lack of training, and organisational hurdles as barriers.
In this article, EMJ spoke to two pioneers of state-of-the-art cardiac fibrosis imaging: Francis E. Marchlinski, Perelman Center for Advanced Medicine, Philadelphia, Pennsylvania, USA, and Antonio Berruezo, Teknon Medical Center, University of Barcelona, Spain. They explain how the limitations of the traditional approaches are contributing to an unmet need in the field of diagnosing and treating cardiac arrhythmias, the challenges and benefits of incorporating advanced imaging into electrophysiology workflows, and how using advanced 3D cardiac imaging can improve outcomes in arrhythmia treatment.
EVOLUTION OF FIBROSIS DETECTION
Combining ECG with imaging techniques allows for safer, more targeted arrhythmia interventions, while also delivering more efficient workflows. Despite growing evidence for this complementary approach, such as its inclusion in 2019 Expert Consensus Statement on Catheter Ablation of Ventricular Arrhythmias,1 it has not yet been widely adopted into standard practice.
Explaining the current state of play, Berruezo and Marchlinski said that ECG was, and would remain, the gold standard for detecting the approximate source of various arrhythmias. However, it does have several limitations, both pre- and intra-procedurally.
Marchlinski said: “Our experience with thousands of patients has allowed us to develop a robust way of looking at 12 ECG leads and determining where the arrhythmia originates. But there are limitations, especially as you get more diseased hearts, the ECG becomes less accurate, particularly for arrhythmias due to large circuits, where the ECG does not tell you exactly where to ablate.”
He described the ECG as “a starting point for regionalisation,” and explained that combining it with cardiac imaging provided a complementary picture to increase precision. Over the years, we have recognised that the reason people develop arrhythmias is typically because of abnormal anatomy. Definition of that abnormal anatomy, with a variety of imaging techniques, helps us to focus our attention on the regions of interest for more detailed, focused electrical recordings once we start mapping with catheters,” he said.
Echocardiogram was once the standard imaging technique in this scenario, noted Berruezo. “However, it has low sensitivity in identifying fibrosis, especially when the volume of fibrotic tissue is low, and when it is only affecting the sub-endocardium,” he said. It is also challenging to identify hypokinesia on echocardiogram. As such, MRI has emerged as the modality of choice for fibrosis identification, revealed Berruezo, explaining that it was able to detect areas of fibrotic tissue, as well as wall thinning.
Now, advanced image processing software, which replaces black and white DICOM images with a full-colour, 3D reconstruction of the anatomy, promises to take cardiac imaging to the next level.
Marchlinski described the advances, which “give you a surgeon’s view of the heart,” as “really exciting.” “At [my institution], we have been using 2D imaging for a while,” he said. “The next step for us is [the implementation of] very sophisticated techniques where you can use reconstructed 3D images and get well-defined areas of normal and abnormal anatomy and integrate them into our mapping systems. It gives you a roadmap for where the anatomic abnormalities are, and where to focus your electrical recordings. It’s been breathtaking in terms of the information that can now be gleaned.”
Explaining the process, Berruezo said the acquired images are processed with Automatic Detection of Arrhythmic Substrate (ADAS 3D) software (ADAS3D Medical SL, Barcelona, Spain), and merged into the navigation system.
“We use them to form the pre-procedure plan, and then start the procedure. The first step is the reconstruction of an anatomic structure, usually the aortic arch, with the mapping catheter for electroanatomic map, and image integration. The next step is navigation, without the need for fluoroscopy, and mapping directed to the scar identified by the images. Different mapping manoeuvres can characterise the critical scar components as identified by the images,” he said.
The technique has an extremely important role to play in pre-procedure planning, he stated, explaining that electronic anatomic mapping (EAM), despite being the most widely used method for ventricular tachycardia (VT) substrate identification and targeting ablations, was sometimes imprecise when used alone. “Even when using multi-electrode mapping catheters, EAM is less sensitive to identifying the VT substrate, especially if this is located deep in the left ventricle wall or the epicardium. The scarring is obscured, in some cases, by the far-field effect of the surrounding tissue,” he said. “With these imaging techniques, you can see the VT substrate before you even begin the procedure.”
A 3D visualisation of the full extent of the scarring, including its distribution, core, and border zone across segments, can improve the accuracy and reduce the duration of mapping (Figure 1).
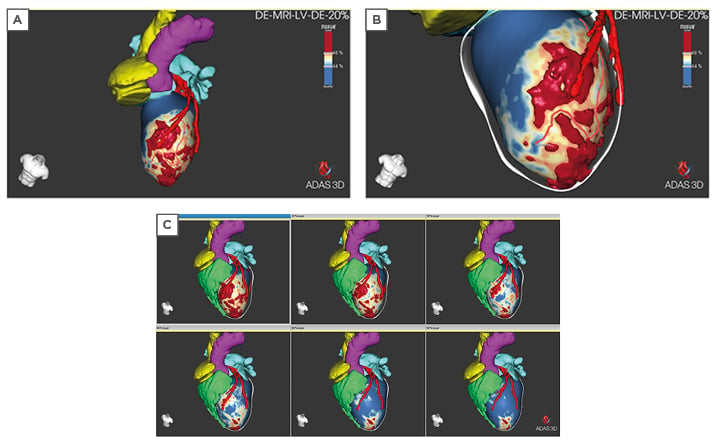
Figure 1: 3D visualisation of extent of scarring. A) 3D volume of the core scar is shown on the 20% layer (endocardial). Core scar is red, border zone is green-yellow, healthy tissue is blue. B) ADAS 3D left ventricular image highlighting a corridor of border zone tissue in the 20% layer. The centre line of the border zone is illustrated with the solid red line. C) ADAS 3D left ventricular image of 20% (endocardial top left), 30%, 50%, 60%, 80%, and 90% (epicardial bottom right) layers. Adjacent coronaries from CT are shown in red, right ventricle (green), left atrium (cyan/light blue), aorta (pink). ADAS: Automatic Detection of Arrhythmic Substrate (ADAS 3D) software (ADAS3D Medical SL, Barcelona, Spain).
Marchlinski said: “Planning is important, and we have always used imaging to get us there. This incredibly detailed 3D imaging gives us the location of the intramural scar, areas of epicardial scar, and the incredible ability to characterise, in three dimensions, the nature of the scar, where there are gaps, or lack of continuity, as well as what we refer to as non-ischaemic scar, patches of scar and other areas responsible for arrhythmias that may not have been identified with just coronary angiography or looking at the ECG.”
OUTCOME BOOSTING COMBINATION
Marchlinski was keen to point out this was a complementary approach, and that both physiology and advanced imaging had something to bring to the table when diagnosing and treating arrhythmias. It is the combined pictures of electrical readings and imaging that provides the detailed information on the arrhythmia circuit that clinicians need.
“Electrical recordings are very valuable. We always say electrograms never lie.” He added that imaging “works hand in glove with the electrical information.” This is particularly true when investigating intramural areas that cannot directly be registered with electrical information; when attempting to capture information from the opposite side of the heart, such as the epicardium; and when access is complicated. “It is not that each is perfect. When you use them together, your procedures are faster, and you focus your electrical readings in a more appropriate way. You apply the energy more safely.”
The results, Berruezo and Marchlinski agreed, were higher clinical value, higher efficacy, and improved workflows. If imaging could reduce the need to induce VT during an ablation procedure, it would make treating patients who become haemodynamically unstable easier, explained Berruezo. “This not only leads to better outcomes and fewer complications during ablation, but also decreases early mortality.”2
In addition, the approach can reduce the time it takes to perform an ablation from more than 4 hours in some centres to just 30 minutes, he said. “Imaging permits us to transform complex ablation into an easier, safer, faster, and more reproducible procedure that can be performed during a stable sinus rhythm in the majority of cases,” commented Berruezo.
CHALLENGES
Devices and MRI
There is a strong body of evidence to support the use of 3D imaging in the detection and treatment of arrhythmias. For example, in a recent meta-analysis of image-guided versus conventional VT ablation, VT-free survival was observed in 82% (interquartile range [IQR]: 74–90%) of those receiving image-guided ablation compared with 59% (IQR: 54–64%) of those receiving conventional mapping (p<0.001) during a 35-month mean follow-up period. There was an overall survival rate of 94% (IQR: 90–98%) in the image-guided cohort versus 82% (IQR: 76–88%) in those patients treated conventionally (p<0.001).3
In addition, the 2019 Expert Consensus Statement on Catheter Ablation of Ventricular Arrhythmias recommends using this technique adjunctively to guide VT ablation procedures and describes it as both accurate and non-invasive.1
However, there is still some resistance in terms of introducing it into standard workflows. One of the main barriers, said Marchlinski, is perceived safety issues. “In some radiology departments, there is still some concern related to the safety of imaging people with implantable electronic devices (IED), worries that it might create heating and damage the technology or the site where the leads contact with the heart.”
However, the data, and clinical experience, demonstrate otherwise, said Marchlinski, whose centre has been routinely imaging patients, including those with devices, “for some years.”
In 2016, Dandamudi et al.4 published a review of outcomes experienced by 58 people with IEDs who underwent cardiac or thoracic MRI. The study found no clinically significant changes in atrial and ventricular sensing, impedance, or threshold measurements. There were no episodes of device mode changes, arrhythmias, therapies delivered, electrical reset, or battery depletion.
Another observational study of 139 patients concluded that the risk of MRI in people with abandoned leads was low.5
“We know we can do this safely. Treatment protocols are approved by institutional review boards, and patients are counselled on the low potential for risk and monitored carefully. Devices are also checked post-procedurally to make sure there have been no adverse effects,” said Marchlinski.
Berruezo said his department scans all patients before they receive an implantable cardioverter-defibrillator (ICD) to obtain a reference point, a pathway that reflects the consensus guidelines.1
As Dandamudi et al.4 concluded: “When a comprehensive IED magnetic resonance safety protocol is followed, the risk of performing 1.5T magnetic resonance studies with the device in the magnet isocenter, including in patients who are pacemaker dependent, is low.”
Another commonly cited barrier to adoption is concerns around the noise artefact that can occur when imaging people with devices or leads. Again, Marchlinski said, this unease was unnecessary, explaining that wide-band sequences could largely deal with the problem.
Berruezo said it was also worth noting that inferior myocardial infarctions are less affected by artefacts. The same is true of ICDs implanted on the right, and “probably” subcutaneous ICDs. Manoeuvres, such as displacing the ICD to an upper position, can also be helpful in reducing noise.
“The fear that has been associated with using MRI in people with devices should be forgotten. It should be embraced as a standard because it adds value. It has been tried and tested for years and there are plenty of publications and documents from the evidence-based literature to support this becoming the new standard of care,” said Marchlinski.
Organisational Barriers
Even those convinced of the benefits of advanced imaging in the detection and treatment of arrhythmias experience organisational barriers in terms of bringing the technology into standard practice. Overcoming logistical challenges is essential, and success relies on cross-specialty collaboration, particularly between electrophysiology (EP) labs and radiology departments.
“Everybody is using imaging now, so everybody has to stand in line,” said Marchlinski. “If you are going to start using it, you need to have a workflow, both in EP and radiology, that will facilitate that. It is critical these workflow issues are addressed.” For this to happen, both departments need to understand and embrace the role of advanced imaging, and follow standardised protocols that guarantee image quality. “We have been very lucky at Penn. We have some great colleagues who have been at the forefront of this. They have pushed to make it happen, and were willing to add patients to the schedule. But it does take co-operation, otherwise the roadblocks are cumbersome,” he said.
There are also training needs on both sides of the coin (3D image acquisition and processing), said Berruezo. He explained that while most MRI machines will have 3D capability, not all radiologists were accustomed to using the method. Fortunately, he went on, it would take “fewer than a dozen cases” to bring radiologists up to standard of 3D MRI imaging acquisition.
Electrophysiologists also need to become familiar with the use of advanced 3D imaging. “The software we use, ADAS 3D, is available, and has CE [Conformitè Europëenne] approval and FDA [U.S. Food and Drug Administration] clearance,” said Berruezo. Image processing can be done by anyone in the EP lab, including physicians, technicians, or engineers, all of whom will be able to quickly scale the short learning curve, he added, explaining the time per procedure was typically 15–20 minutes, and tends to shorten with adoption.
Another hurdle is securing approval for additional costs associated with 3D image acquisition and advanced processing software. “If you begin to use the software, the initial costs will affect your early revenue, therefore you have to approach your supply chain committees of your hospitals and say what value it provides. You have to show them evidence-based literature, and hopefully your own experience with preliminary data, that shows that this does work, this does enhance efficacy, and there is some reduction in the duration of procedures, so your costs related to procedural time is reduced,” said Marchlinski. Crucially, improving outcomes results in added value, particularly for the patient, making the investment worthwhile, he added.
Berruezo agreed, adding that the 2019 consensus document meant hospitals “should understand they should acquire” the imaging solution, which he described as inexpensive. “It is now a Class IIa recommendation to use imaging to pre-plan the ablation procedure, and it is also a Class IIa recommendation to use it inter-procedurally to improve outcomes,”1 he said. “This is something that will help physicians to improve outcomes, so there is an obligation to do it.”
NO GOING BACK
Both Berruezo and Marchlinski routinely scan patients before implanting an electronic device, and both say they would never go back. “We love imaging,” said Marchlinski, “the more information the better.”
Asked his advice to his colleagues around the world, Berruezo said the sooner they start using advanced 3D imaging the better. “After they have done a few cases, they will never again do VT ablation without imaging, if it is available.”
Imaging is not going anywhere. If anything, it will only get more advanced and provide more opportunities, said the two experts. Berruezo stated: “We are at the era of ‘virtual dissection’. 3D anatomy and the possibility to see the structure of the heart and the substrate for VTs in 3D is providing a new way to learn. I’m sure we have only just begun to learn the possibilities of applying this technology to new ways of performing VT ablation.”
Marchlinski agreed, saying that “a lot of smart people” were making “a lot of smart correlations” based on 3D image data. “In the future, I think there will be real-time advanced 3D imaging. I think we will be ablating patients inside the MRI magnets so we can watch lesion formation. There will be real time imaging where we will get ongoing images, while we are applying the energy, and changing the anatomy.”
The potential use of advanced imaging to guide focused radiotherapy ablation in patients who are not stable enough, due to the complexity of disease or access issues, for example, to undergo electrophysiology, is another area of growing interest. Marchlinski said: “If we use imaging appropriately, and as we define and confirm the reliability of these imaging signature patterns for identifying circuitry of ventricular arrhythmias, you can see where this type of data will serve some patients as standalone information to help guide ablative therapy when you are using external beam radiation to try to target and eliminate arrhythmias.” He described it as an “important, non-invasive strategy” that was currently being explored.
It is time, they both agreed, for EP and radiology colleagues to embrace advanced 3D imaging. “It is a valuable tool, and it’s recommended in the guidelines,” said Marchlinski, advising people to take advantage of imaging to help guide ablation when they can. “From the very simplest pieces of information, when there’s intramural data, or intramural abnormalities, or epicardial abnormalities, to now more sophisticated, detailed definition on a 3D basis with this very sophisticated 3D reconstruction software. When you combine that anatomic information with the electrophysiology, it makes sense that you are going to get the best outcomes. That’s been in all the preliminary experience, and that’s been in the observational data.”
Berruezo agreed: “It is highly precise, permits ablation to be very directed at target sites, and provides accurate revelations with very small needs in terms of procedure duration and risk of complications.” It is all about, he added, improving patient outcomes.