Abstract
Introduction and objective: The role of spirometry in the diagnosis of restrictive lung diseases is unclear. This study investigated the sensitivity and specificity of the forced expiratory flow 25–75 (FEF25–75)/forced vital capacity (FVC) parameter in diagnosing restrictive lung disease.
Methods: In this study, the records of all restrictive patients who were referred to the pulmonary centre of Imam Khomeini Hospital, Tehran, Iran, from March 2021–March 2022 have been reviewed, and the indexes in the body box and spirometry have been recorded.
Results: A total of 527 people were included in the study. Among them, 134 people (25.4%) had restrictive lung disease. The average area under the graph of the FEF25–75/FVC index is 0.648±0.028. It can be said that the area under the graph for the FEF25–75/FVC index is between 0.594–0.703. The FEF25–75/FVC index at values above 79.90 has a sensitivity of 70.9% and a false positive rate (1- specificity) of 53.2%.
Conclusions: According to the result of this study, the ratio of FEF25–75/FVC index in spirometry at above 79.90 has a sensitivity of 70.9% and a false positive rate (1- specificity) of 53.2%. Therefore, it can be used as a screening test for restrictive lung diseases.
Key Points
1. A restrictive disease pattern is seen in approximately 20% of patients with pulmonary syndromes. Whilst the global prevalence of restrictive lung disease is unclear, studies from the USA suggest the overall prevalence rate is 3–6 cases per 100,000 people.
2. In this single-centre retrospective study of 527 patients, 134 had restrictive lung disease and 393 had non-restrictive lung disease. The FEF25–75/forced vital capacity (FVC) ratios were calculated for all patients included in the study, and the analysis revealed that a FEF25–75/FVC ratio with a cut-off value of 79.90 displayed a sensitivity of 70.9% and specificity of 53.2%.
3. The authors recommend that the FEF25–75/FVC ratio can be used as a screening test to identify restrictive lung disease earlier, and that patients should be referred for plethysmography if their FEF25–75/FVC ratio is >79.90.
INTRODUCTION
There are two major categories of lung functional disorders, including restrictive and obstructive lung diseases.1 Restrictive lung disease is characterised by a decrease in lung volume.2-4 Intrinsic causes, such as inflammation and toxins, as well as extrinsic conditions, including extraparenchymal conditions like kyphoscoliosis and obesity, can lead to destructive lung parenchyma and cause restrictive lung diseases.5-7 Approximately one-fifth of pulmonary syndromes have restrictive lung patterns, while the majority of cases (80%) have obstructive patterns.8 The worldwide prevalence of restrictive lung disease is challenging to determine due to the lack of large-scale studies. However, studies conducted in the USA regarding intrinsic lung disease indicate an overall prevalence rate of 3–6 cases per 100,000 people.9
Pulmonary function tests (PFT) are used to assess pulmonary restriction. The main tests of PFT include spirometry, body plethysmography, and gas diffusion.10-14 Spirometry is a beneficial screening test to evaluate lung function, and can classify results into obstructive and restrictive lung diseases.15-17 If spirometry suggests a restrictive pattern, to differentiate between restrictive and obstructive lung diseases, physicians, along with spirometry, may perform two specific assessments, including diffusing capacity for carbon monoxide (DLCO) and pulmonary plethysmography.18
In spirometry, the pattern of restrictive lung disease is opposite of obstructive disease.19,20 The primary findings that indicate restrictive lung disease are decreased total lung capacity (TLC) with a preserved forced expiratory volume in 1 second (FEV1) and forced vital capacity (FVC) ratio greater than 70%.21 FVC and TLC are reduced, while FEV1 is usually slightly reduced or normal.21 Forced expiratory flow (25–75; FEF25–75)/FVC is used in spirometry to detect the disproportionate size of the airways relative to the lung volume. As the diameter and capacity of the airway decrease or the lung volume increases, FEF25–75/FVC decreases.22
DLCO measures the exchange of O2 and CO2 between the alveoli and capillaries in the lungs. It might be lower in certain restrictive lung diseases due to the thickening of the membrane.18 DLCO is reduced in patients with intrinsic pulmonary restriction.23 Patients with extrinsic pulmonary restriction also show a restrictive pattern in PFT, but their DLCO is typically normal.24
Body box or plethysmography, unlike spirometry, offers characteristics such as residual lung volume, TLC, or airway resistance.25,26 Assessing TLC is crucial in diagnosing restrictive patterns, and TLC below the 5th percentile is indicative of this condition.27 If the vital capacity is decreased and the FEV1/FVC ratio is normal or increased, restrictive lung disease may be suspected during spirometry. However, this can only be confirmed by measuring TLC using plethysmography.27 Additionally, other findings of a restrictive pattern in plethysmography include a decrease in functional residual capacity and TLC, normal resistance, and reduced or normal residual volume.28
While plethysmography is considered the gold standard for diagnosing restrictive lung diseases, it can be time-consuming and expensive compared to spirometry.29 Moreover, recent studies have placed less emphasis on this topic. Therefore, in this study, the authors aim to assess the sensitivity and specificity of the FEF25–75/FVC parameter in diagnosing restrictive lung disease.
MATERIALS AND METHODS
In this retrospective study, medical records of patients at the pulmonary center of Imam Khomeini Hospital in Tehran, Iran, from March 2021–March 2022 were analysed.
In this study, patients were divided into restrictive and non-restrictive groups according to the results of the plethysmography. Patients with TLC lower than 80 and FEV1/FVC greater than 70% were considered a restrictive group, and other patients were considered a non-restrictive group. These criteria were applied according to the European Respiratory Society (ERS) and American Thoracic Society (ATS) guidelines.30,31 Then, the FEF25–75/FVC ratio was calculated in these groups.
The inclusion criteria were patients whose restrictive lung disease had been proven through PFTs such as spirometry and plethysmography during the aforementioned period. Spirometry and plethysmography results for each patient would be investigated and compared separately. The required variables were demographic characteristics, BMI, body surface, and spirometry and plethysmography parameters (FVC, TLC, FEF25–75, FEF25–75/FVC), which were gathered from the medical records of patients. The exclusion criteria were patients who did not perform lung tests correctly, as well as patients with restrictive lung disease who did not perform plethysmography during the diagnosis process. Ganshorn (Ganshorn Schiller Group, Niederlauer, Germany) equipment was utilised to perform the index and the standard tests. The authors collected data after conducting tests.
This study was a file study, and the patients were not present. All terms of confidentiality for the patients have been preserved, and the data was collected in coded form in accordance with the Declaration of Helsinki. This study was confirmed by the ethics committee of Imam Khomeini Hospital, and written consent forms were obtained from the participants.
All statistical analyses were conducted using IBM® (Armonk, New York, USA) SPSS version 22 software. The qualitative and quantitative data were assessed by χ2 test and t-test, respectively, and the test results were analysed by receiver operating characteristic (ROC) curve.32
RESULTS
A total of 527 people were recruited for the study. Among them, 134 people (25.4%) had restrictive lung disease. Demographic and pulmonary parameters in the restrictive and non-restrictive groups are demonstrated in Table 1.
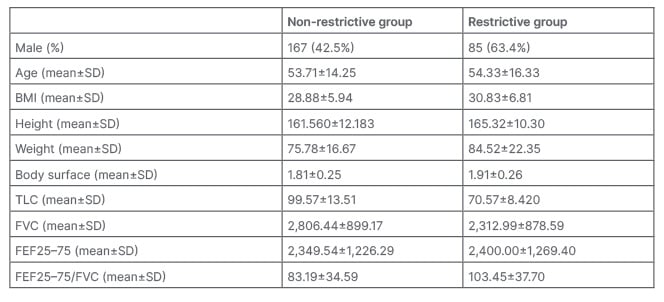
Table 1: Demographic and pulmonary parameters description in the restrictive and non-restrictive group.
FEF25–75: forced expiratory flow 25–75; FVC: forced vital capacity; SD: standard deviation;
TLC: total lung capacity.
In the non-restrictive group, 167 (42.5%) were male, and in the restrictive group, 85 (63.4%) were male. The frequency of restrictive lung disease was significantly higher in males than in females (p=0.000).
The ROC curve is shown in Figure 1. The average area under the curve (AUC) of the FEF25–75/FVC index is 0.648±0.028. It can be said that the AUC for the FEF25–75/FVC index is between 0.594–0.703, which means that the FEF25–75/FVC index has low accuracy (Table 2). The overall performance and accuracy of the test depend on various factors, such as the specific context, the nature of the disease or condition being tested, and the predetermined threshold value. Based on these characteristics, this curve could be utilised for different purposes. The FEF25–75/FVC index in the patients of the present study at values above 79.90 has a sensitivity of 70.9% and a false positive rate (1- specificity) of 53.2%. Other values are demonstrated in Table 3.
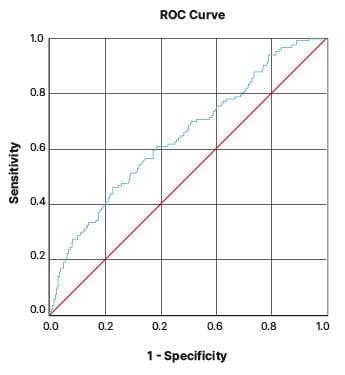
Figure 1: Receiver operating characteristic curve.
Diagonal segments are produced by ties.
ROC: receiver operating characteristic.

Table 2: Receiver operating characteristic curve information.
AUC: area under the curve; CI: confidence interval; FEF25–75: forced expiratory flow 25–75; FVC: forced vital capacity.
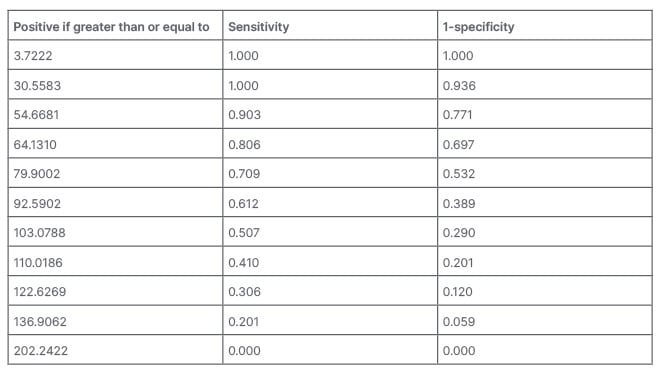
Table 3: Specific points of the receiver operating characteristic curve.
DISCUSSION
Until now, the gold standard diagnostic method for restrictive lung diseases has been plethysmography. Spirometry is more cost-effective and accessible than plethysmography. As a result, the authors assessed the sensitivity and specificity of the FEF25–75/FVC ratio of spirometry.
According to the patients’ ROC curve, AUC, and the tables that described sensitivity and specificity, it could be concluded that if the ratio of FEF25–75/FVC is lower than the numbers in the table, it lacks specificity and sensitivity, and cuts the middle line of the curve below it (Figure 1). If the FEF25–75/FVC ratio is larger than the numbers shown in Table 3, it is considered significant. Based on different applications, such as screening, this ratio value can be changed.
According to the examination of the appropriate point of the FEF25–75/FVC index, if a point of 79.90 is selected as the cut-point, the sensitivity would be 70.9%, and the false positive rate would be 53.2%, which is acceptable.
The FEF25–75/FVC ratio is a measure used in spirometry to identify any imbalances between the size of the airways and lung volume. When the diameter and capacity of the airway decrease or the lung volume increases, the FEF25–75/FVC ratio decreases. However, in restrictive lung diseases, although the lung volume decreases, the increase in elastic recoil prevents airway collapse during the latter part of the FVC test. As a result, the FEF25–75/FVC ratio tends to show an increase.22
There are few studies on the FEF25–75/FVC ratio. The association of the FEF25–75/FVC ratio with several conditions has been assessed. These conditions include obstructive lung diseases, like asthma, methacholine airway responsiveness, ambient ozone, torquetenovirus, anthracofibrosis, trawler fuel exhaust, ataxia-telangiectasia (AT), left ventricular hypertrophy in patients with morbid obesity, and BMI.33-41 The relationship between this ratio and restrictive lung disease has not been directly studied in previous studies.
Mirsadraee et al. conducted a case-control study of the accuracy of FEF25–75/FVC for primary classification of the PFT in 2019, in 80 people with a clinical diagnosis of chronic obstructive pulmonary disease (COPD) and idiopathic pulmonary fibrosis. The FEF25–75 and FEF25–75/FVC showed the highest sensitivity and specificity. FEF25–75/FVC was useful in diagnosing difficult cases, such as the combined pattern in spirometry, or spirometry results that do not match clinical findings and require TLC measurement. Moreover, this index can classify pulmonary patients into four groups, and its confirmation with the clinical diagnosis was more than FEV1/FVC and residual volume.42 An observational study performed by Abston et al.37 in 2017 demonstrated that higher BMI was associated with higher FEF25-75/FVC and air trapping in COPD. BMI has a role in developing restrictive mechanisms. The ratio of FEF25–75/FVC appeared to quantify how obesity affects the phenotype of COPD. This ratio was independently associated with COPD exacerbations and mortality.37
A retrospective study by Vilozni et al.39 in 2015 was conducted on 37 patients with AT. Restrictive lung disease frequently occurs in individuals with AT, a rare and progressive multisystem disorder. The FEF25–75/FVC ratio may reveal a higher respiratory effort. Further results show that TV/FVC and FEF25–75/FVC ratios are better added to the assessment of pulmonary function in patients with AT.39
Mead et al.43 made a ratio that involved multiplying lung elastic recoil with FEF25–75/FVC. The purpose was to indicate the size of the airway structure in relation to the volume of the lung. This ratio showed how variations in growth patterns between genders could impact the geometry of the tracheobronchial tree and lung parenchyma, which is referred to as dysanapsis.43
Several studies assessed the relationship of FEF25–75/FVC with obstructive lung disease. DeMeo et al.44 did a study that demonstrated non-smoking first-degree relatives of patients with early-onset COPD had lower levels of FEF25–75 and FEF25–75/FVC compared to controls.44 Rao et al.45 assessed the effectiveness of using forced expiratory flow rates between 25–75% of vital capacity as a means of predicting the severity and incidence of asthma in children. A study done by Litonjua et al.46 in 1998 found a significant link between FEF25–75/FVC and methacholine airway responsiveness. It can be a valuable marker for determining airway responsiveness, irrespective of any pre-existing respiratory conditions or risk factors.46
This study was conducted in a university hospital, and the results cannot be generalised to all hospitals. It is recommended to implement a similar study in other medical centers.
Also, it is suggested to perform this study by taking some drugs or interventions. It can be done on other spirometry indices to increase the sensitivity and specificity of the test by combining several indices.
CONCLUSION
The ratio of FEF25–75/FVC in spirometry at a cut-off point of 79.90 has a sensitivity of 70.9% and a specificity of 53.2%. Therefore, it can be used as a screening test for restrictive lung diseases. It is recommended that if the ratio is higher than 79.90, the patient be referred for plethysmography. Doing this can detect many lung diseases before they enter the terminal phase. Also, it is possible to avoid financial costs and morbidities.