
Virtual liver biopsy (VLB) can be considered a multicomponent imaging biomarker able to provide fundamental information on the presence, distribution, and amount of different pathological changes in diffuse liver diseases by controlling the effect of fat, iron, inflammation, and fibrosis on the magnetic resonance imaging (MRI) signal. VLB assesses quantitative changes. The provided imaging biomarkers, extracted by MRI signal computational processing techniques, are resolved in space (parametric images) and time (follow-up studies) (Figure 1) VLB addresses the main biopsy limitations, such as a small sample size, heterogeneous tissue distribution of the pathological hallmarks, large inter and intra-observer scoring variability, and procedure- related morbidity.
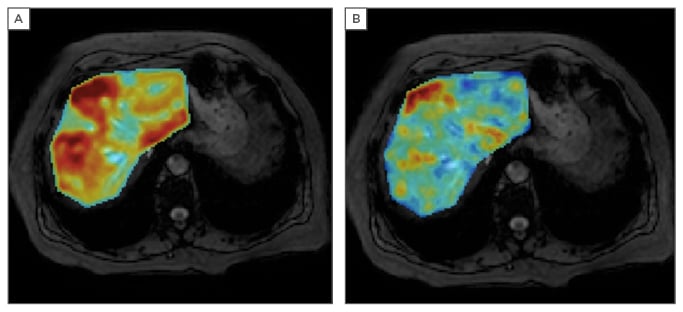
Figure 1: Parametric liver MRI showing the quantitative analysis of a female patient, 69 years old, with increased serum ferritin (394 ng/mL). The PDFF (A) and R2* (B) parametric maps demonstrate liver steatosis and an increased amount of hepatic iron deposits, both with a heterogeneous distribution throughout the parenchyma.
MRI: magnetic resonance imaging; PDFF: proton density fat fraction.
MRI is sensitive and efficient in measuring liver fat and iron on a voxel-by-voxel basis as the signal is proportional to the fat (chemical shift effect) and iron (T2* decay) content. For an accurate determination, several biases must be controlled. The main confounding factors to be corrected are the T1 bias, as initial signal intensities of water and fat are different; the T2* decay bias to correct for the effect of iron in the signal; and the spectral complexity of the fat spectrum frequencies. The T1-independent T2*-corrected multi-echo chemical shift encoded (MECSE) sequence, with magnitude and phase information, allows determination of both the proton density fat fraction (PDFF; %) and the iron-related R2* water signal component (s-1). Simultaneous modelling of the signal improves the robustness and accuracy of these imaging biomarkers of liver steatosis and iron.1 MRI quantification of fat and iron provides numerical and continuous measurements, rather than categorical or semi-quantitative grades as liver biopsy does (Figure 1).
PDFF and R2* are highly related to liver biopsy results, both ordinal scores and absolute values. In our recent publication on 109 patients with histology as gold standard, a high correlation was observed.2 We found that the calculated PDFF measurements showed significant differences (p<0.001) among steatosis grades, being unaffected by iron, inflammation, or fibrosis. A strong positive correlation was also observed between R2* measurements and iron grades (Rs=0.71, p<0.001). Therefore, MECSE-gradient echo breath-hold (12 seconds) calculations were accurate for the simultaneous identification and quantitation of liver steatosis and siderosis, as they had excellent linearity, negligible bias, and high precision across different field strengths, vendors, and reconstruction algorithms (Quantitative Imaging Biomarkers Alliance [QIBA]). MECSE MRI is considered more precise than liver biopsy for therapy, monitoring steatosis and iron overload.
Regarding inflammation, the short tau inversion recovery (STIR) sequence allows a semi-quantitative evaluation because a healthy liver signal is similar to fat (TI ≈ 150 ms at 1.5T; 180 ms at 3.0T), while liver brightness increases with the water content related to the necro-inflammatory development.3 Unfortunately, signal also relates to the iron content, which is a confounding variable.
To improve the MRI accuracy, the diffusion-weighted images allow the evaluation of the signal decay due to the diffusion restriction associated to the intracellular oedema and macrophage infiltration. The signal decay observed by using multiple b-values and a bi-exponential fitting allow the application of the intra-voxel incoherent motion model. The apparent diffusion coefficient (ADC), perfusion related (D*), vascular fraction (f), and pure diffusion (D) metrics can be calculated.4 ADC and f values were significantly lower with higher fibrosis stages (p=0.009, p=0.006, respectively), and with higher necro-inflammatory activity grades (p=0.02, p=0.017, respectively). However, only fibrosis seemed to present a significant effect on ADC and f measurements (p<0.05). It was found that the D values were influenced by steatosis and iron overload. The intra-voxel incoherent motion measurements were not accurate enough to clinically stage liver fibrosis or necro-inflammatory activity in diffuse liver diseases.