Abstract
Nonalcoholic fatty liver disease (NAFLD) is the most common cause of chronic liver disease worldwide. Liver biopsy is the gold standard for diagnosis and staging of fibrosis in patients with NAFLD; however, it is invasive, costly, and may be associated with morbidity and even mortality, so is not suitable for screening the large number of individuals who are at risk of, or have, NAFLD. Therefore, there has been tremendous focus on finding non-invasive diagnostic modalities, including imaging. New imaging modalities are emerging and may potentially replace biopsy. This review discusses the different non-invasive imaging modalities for the assessment of NAFLD.
INTRODUCTION
Nonalcoholic fatty liver disease (NAFLD) is the most common form of chronic liver disease in developed countries.1 It is defined as the presence of at least 5% of hepatic steatosis on histology or imaging in absence of significant alcohol use and other secondary causes of steatosis.2 NAFLD has been clinically associated with metabolic disorders such as obesity, diabetes, and dyslipidaemia. It consists of a wide spectrum of clinico-pathologic presentations ranging from simple steatosis to nonalcoholic steatohepatitis (NASH), liver cirrhosis, and hepatocellular carcinoma (HCC).3-6 The top three leading causes of death in patients with NAFLD, in descending order, are cardiovascular disease, cancer, and liver disease.3 Therefore, early identification of this disease is paramount.
The gold standard for diagnosis of NASH is liver biopsy; however, this is invasive, costly, and risks complications.7 Thus, biopsy is not practical for the screening or monitoring of NAFLD.8,9 Non-invasive diagnostic techniques, such as serum biomarkers and imaging studies, have emerged. Imaging, in particular, has gained importance in the non-invasive diagnosis of hepatic steatosis.
IMAGING IN NAFLD/NASH
Ultrasonography
Ultrasonography is the most commonly used imaging modality for evaluating hepatic steatosis.
Ultrasound (US) is accepted as an initial screening for fatty liver because it is safe, widely available, well tolerated, and inexpensive.10-13 It also plays a key role in ruling out focal liver lesions and characterising them.14 There are numerous sonographic features of steatosis, such as the ‘echogenicity’ of the liver relative to the adjacent right kidney, hepatomegaly, and blunting of liver structures. Recent studies suggest that fatty infiltration of the liver can change the Doppler waveform of the hepatic veins.15,16 The degree of steatosis can be subjectively scored as mild, moderate, and severe, or, as reported in some studies, by using ordinal US scores.17,18
In a large meta-analysis of patients with suspected or known liver diseases, the reported sensitivity and specificity of US in distinguishing moderate-to-severe fatty liver from the absence of steatosis, was 85% (80–89%) and 93% (87–97%), respectively. Nevertheless, US lacks the sensitivity for detection of liver fat and is considered inaccurate in differentiating fibrosis from steatosis or quantifying the fat accumulation. US can only detect steatosis if the liver fat content is above 12.5–20.0%.9 Another major weakness of US is its operator dependency. Numerous factors can affect the sonographic features besides hepatic steatosis, such as obesity, renal disease, equipment-related factors, operator dependency, and the qualitative interpretation. Consequently, US has limited accuracy, repeatability, and reproducibility for diagnosis and evaluation of the degree of hepatic steatosis.20-23 Such limitations may be at least partially overcome by semi-quantitative indices, which are correlated with metabolic derangements and histological features in various liver diseases, notably including NAFLD both in adults and in children.24,25 Despite its undisputed limitations, US remains a first-line option technique in the investigation of NAFLD.26
Computed Tomography
X-ray CT uses the density of liver to spleen ratio to detect hepatic steatosis. NAFLD is typically an incidental finding on CT that is being performed for another indication. CT has fallen out of favour for diagnosis of hepatic steatosis for multiple reasons, including exposure to ionising radiation and lack of accuracy and reliability, especially for the detection of small fractions of fatty infiltration.27 Moreover, it has been demonstrated that CT attenuation values vary significantly between different manufacturers’ scanners and image processing techniques.28
Magnetic Resonance Imaging
Magnetic resonance (MR) spectroscopy (MRS) is reportedly the most accurate method for the quantification of steatosis,29,30 but its use is currently limited to research. MRS may be better than histology in assessing longitudinal changes in liver fat content, and is also safe; however, it is expensive and not widely available (Box 1).31
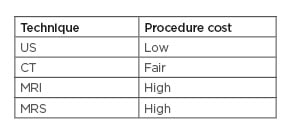
Box 1: Relative cost of current available non-invasive techniques for liver steatosis assessment.
CT: computed tomography; MRI: magnetic resonance imaging; MRS: magnetic resonance spectroscopy; US: ultrasonography.
Magnetic Resonance Elastography
Magnetic resonance elastography (MRE) is the MR equivalent of transient elastography that is considered among the final options to assess hepatic fibrosis in patients with NAFLD. It uses a modified phase-contrast method to image the propagation of the shear wave in the liver parenchyma. MRE has demonstrated excellent diagnostic accuracy and ability to exclude significant fibrosis. Studies have shown that MRE has a sensitivity and specificity of 98% and 99%, respectively, for detecting all grades of fibrosis.32,33 When coupled with MRI, MRE can be helpful for the screening of HCC. Another advantage is that MRE accuracy is not affected by obesity or cirrhosis. Since the measured liver area is large on MRE, it can avoid potential sampling errors. On the other hand, MRE may be inaccurate in inflammatory conditions and iron overload. MRE may not be practical for routine screening of NAFLD patients because it is costly, time-consuming, and not readily available. The best indication for MRE may be in morbidly obese patients who fail US-based elastography or need detailed liver imaging.
Magnetic Resonance Spectroscopy
(MRS) is the gold standard for quantification of fat in the liver,34 therefore it can accurately diagnose NAFLD.35 MRS measures the chemical composition of tissue based on proton signals frequency. Most of the identifiable peaks are derived from water and fat, and the fat signal fraction, also known as proton density fat fraction (PDFF) can be calculated.34,36 Therefore, MRS is considered the most sensitive and accurate non-invasive method of quantifying liver fat.30,31,36 MRS has important limitations that preclude its widespread use.37 MRS is time-consuming, not readily available, and requires additional equipment and special expertise.
Vibration-Controlled Transient Elastography
Vibration-controlled transient elastography (VCTE), also known as Fibroscan® (Echosens, Paris, France), is the most commonly used elastography method.38 VCTE is a non-invasive point-of-care method of assessing liver fibrosis by using an US-based technology for estimation of liver stiffness measurement (LSM).39,40 VCTE was originally validated for use mainly in the setting of viral hepatitis.41,42 Studies have shown robust VCTE quality criteria in patients with NAFLD, which include a minimum of 10 measurements that are used to obtain the median LSM and the interquartile range. Two probes are now available: the M-probe and the XL-probe. The latter probe has been introduced due to the high failure rate of VCTE in obese patients.43,44 XL-probes possess a deeper focal length, increased amplitude, and lower shear wave frequency; therefore, they are more reliable in obese patients.45 A multicentre prospective study by Siddiqui et al.46 on NAFLD patients who underwent VCTE found that the diagnostic accuracy of VCTE in differentiating fibrosis stages was lower than previously reported by Tapper et al.47
Controlled Attenuation Parameter
The controlled attenuation parameter (CAP) is a novel tool for the assessment of hepatic steatosis available as an adjunct to VCTE.48 Based on studies, CAP relies on an M-probe of Fibroscan; therefore, it shares the same limitations as VCTE.43 The first study that assessed its performance in patients with chronic liver diseases has reported that CAP was able to accurately detect steatosis ≥11%, ≥33%, and ≥66% with an area under the curve of the receiver operating characteristic (AUROC) of 0.91, 0.95, and 0.89, respectively.49 Nevertheless, a meta-analysis by Karlas et al.50 suggested that CAP does not provide accurate reliable quantification of liver fat. Another meta-analysis of studies using the M-probe has suggested optimal cut-offs of 248 (237–261) dB/m, 268 (257–284) dB/m, and 280 (268–294) dB/m, respectively, for detection of steatosis.51 Others have proposed an optimal cut-off of 288 dB/m.52 The differences in proposed cut-offs can be explained by the variation in BMI and diabetes prevalence in heterogeneous populations, the use of M-probe, and the small sample size in most studies. A multicentre study in NAFLD patients using the XL-probe reported that CAP had an AUROC of 0.76 for detecting steatosis >5% and a 96% positive predictive value.53 Only two studies have performed a head-to-head comparison of CAP with US, showing that the performance of CAP for detecting and grading liver steatosis was higher than that of US; however, the rate of overestimation was significantly higher for CAP than for US (30.5% versus 12.4%; p<0.05).54 Overall, CAP is a useful technique for the rapid quantification of steatosis, but it still needs to be better validated with the XL-probe in patients with NAFLD.
Acoustic Resonance Forced Impulse Imaging and Shear Wave Elastography
Acoustic resonance forced impulse imaging (ARFI) is integrated into a conventional US device and relies on elastography to estimate the LSM in shear wave speed. Shear wave elastography (SWE) adapts US imaging to evaluate liver stiffness. SWE can perform measurements over a wide range of frequencies and regions and thereby reduce sampling errors. SWE may be considered a screening test for patients with mild fibrosis stages according to Cassinotto et al.55 and Leung et al.;56 however, further studies are needed to confirm its applicability to patients with NAFLD. In general, SWE and ARFI are more reliable compared to VCTE in the assessment of liver fibrosis, but the utility of their use in NAFLD is yet to be confirmed as data are currently limited. The quality criteria for the application of ARFI or SWE are limited; thus, further studies are needed to establish those criteria and to define the role of ARFI and SWE in NAFLD so their readings can be standardised.
Discussion
US is not sensitive but is highly specific for detection of moderate-to-severe hepatic steatosis. MRI–PDFF/MRE is considered the gold standard to quantify liver fat due to its high diagnostic accuracy; however, it may not be routinely available and is expensive. It may be used when other tests fail and can otherwise be reserved for clinical studies. CAP readings can be highly reliable if the interquartile range is <30 db/m.57 It becomes less accurate with a dynamic range of liver fat; therefore, it is not reliable in differentiating closely related steatosis stages.42 CAP, when combined with VCTE, may be helpful in screening obese patients for NAFLD. Elastography has gained wide acceptance. The most validated imaging modality in NAFLD is VCTE, which can be performed as a point-of-care test. It is best used to exclude significant fibrosis; however, VCTE is less accurate for low stages of fibrosis. SWE or ARFI may be useful for risk stratification of patients with NAFLD. Imaging in NAFLD is an area of increasing research focus. Further studies are needed to evaluate and quantify the relationship between imaging modalities and clinical status in NAFLD.
Non-invasive imaging methods, together with serum-based biomarkers, can be used as part of targeted screening strategies for NAFLD in primary care settings to improve specialist referral. There is a need for an integrated management plan for NAFLD between primary and secondary care, with robust pathways for subsequent referrals. The absence of well-defined referral strategies can potentially result in missing a substantial proportion of the population at risk.58
CONCLUSION
The non-invasive assessment of NAFLD has progressed significantly. It is important to tailor the choice of non-invasive tests to the setting (primary care, tertiary referral centre, or clinical trial) and clinical needs (screening, staging of fibrosis, or follow-up). Although various imaging techniques are available, US remains the first line technique to be adopted in the evaluation of NAFLD. MRI–PDFF is the most accurate method for detection and grading of steatosis, but it is neither routinely available nor affordable, making it strictly used in research. Until now, there is no imaging modality that can reliably discriminate NASH from simple steatosis. Imaging can help with the identification of advanced fibrosis and, therefore, the appropriate referral for a liver biopsy. The combination of serum markers and liver stiffness, measured using transient elastography, can identify NAFLD patients at a high risk of liver-related complications.