Abstract
Echocardiography has an important role in the diagnosis, treatment, and management of patients who require transcatheter valvular interventions. Left ventricular ejection fraction (LVEF) is a very popular parameter for the assessment of LV function. Although several cut-off values of LVEF have been used for decision making in patients with valvular heart disease, less attention has been paid to its accuracy and reliability. Observer variability is a significant concern, and >10% differences in LVEF measurements between two sonographers could occur in the same two-dimensional echocardiography datasets. The adoption of fully automated LV quantification software with three-dimensional echocardiography (3DE) might be one potential solution to eliminate this problem. We will review the current status of fully automated software with 3DE for the assessment of LV volumes and LVEF.
INTRODUCTION
Patients with severe aortic stenosis (AS) or mitral regurgitation (MR) with multiple comorbidities present as high-risk surgical candidates. Owing to the rapid advancement in transcatheter interventional technology, they could benefit from percutaneous aortic valve replacement (PAVR) or MitraClip® instead of a traditional operation. In the current guidelines, a decrease in the left ventricular ejection fraction (LVEF) is a Class I indication for surgical intervention in AS or MR, with the cut-off being 50% and 60% for AS and MR, respectively.1 LVEF is usually determined by biplane Simpson’s formula with two-dimensional (2D) transthoracic echocardiography (TTE)2 though errors in LVEF values could occur due to measurement (manual tracing of the endocardial border) and recording variability.
CLINICAL CASE
An 80-year-old woman with severe asymptomatic AS (peak transaortic valve velocity: 4.5 m/s; mean pressure gradient: 44 mmHg) presented to the heart valve clinic for regular follow-up. The TTE report showed her LVEF had decreased to 45% (Figure 1A) from 55% when measured 6 months ago by a different sonographer (Figure 1B). As per the recommendations for management of valvular heart disease, she now carries a Class I indication for aortic valve replacement.1 Due to her prohibitive risk for surgical intervention, she would be a candidate for PAVR. A valid question that arises in this context is ‘Should this patient immediately undergo PAVR?’
Before considering the operative procedure, we need to determine if the apparent reduction of LVEF is a true impairment. In this case, no obvious changes in LVEF (53% and 54%) were observed using three-dimensional echocardiography (3DE) guided Simpson’s method with 2DE images extracted from 3DE (Figure 1C and 1D). Acquisition of the same cut views of 2DE images during serial examination is often difficult because subtle changes of transducer position and angulation make different cut-planes, which results in over and underestimation of LV volumes and ejection fraction. Since 3DE datasets encompass the whole part of the left ventricle, it is possible to obtain the same 2DE cut views extracted from serial 3DE datasets. This case illustrates that it is important to rule out observer and recording variability as a cause of false positives.
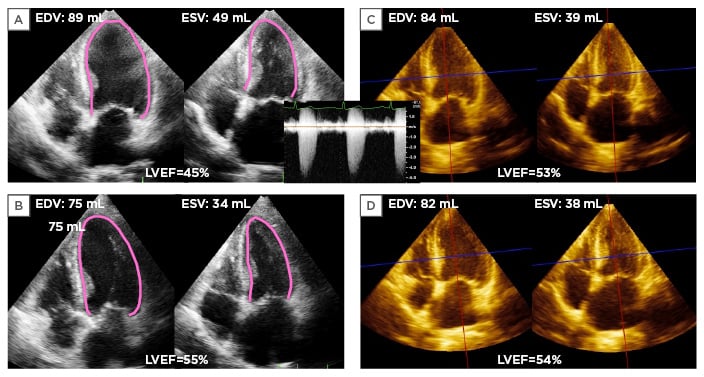
Figure 1: An asymptomatic severe aortic stenosis patient whose left ventricular ejection fraction decreased 10% during serial echocardiography studies.
A) 2D apical 4-chamber view at end-diastole and end-systole in an 80-year-old woman with asymptomatic severe aortic stenosis. The EDV, ESV, and LVEF were 89 mL, 49 mL, and 45%, respectively, measured by the biplane Simpson method. B) Corresponding apical 4-chamber view at 6 months ago showing her EDV, ESV, and LVEF were 75 mL, 34 mL, and 55%, respectively. C) Apical 4-chamber view extracted from 3D full volume dataset at current examination. EDV, ESV, and LVEF were 84 mL, 39 mL, and 53%, respectively, measured by 3DE guided 2DE biplane Simpson method. D) Corresponding apical 4-chamber view extracted from 3DE datasets at 6 months ago showing her EDV, ESV, and LVEF were 82 mL, 38 mL, and 54%, respectively. This case illustrates that interobserver variability resulted in differences in measurement without identifiable interval changes in LV geometry.
EDV: end-diastolic volume; ESV: end-systolic volume; LVEF: left ventricular ejection fraction; 3DE: 3D echocardiography.
Sonographers differ in their individual practices in endocardial border tracing, resulting in different LVEF values in the same 2DE image. Additionally, repeated echo examinations account for the greatest source of variability because subtle differences in serial 2DE recording images might influence measurements of LVEF.3,4
Although cardiac magnetic resonance (CMR) is a reference standard for the quantification of LV volumes and ejection fractions with high accuracy, it is not possible to perform CMR in every patient due to cost, availability, and some contraindications. A potential solution to this common clinical dilemma could be application of fully automated quantification software with 3DE. Fully automated analysis eliminates measurement variability between different observers. We reviewed the current status of 3DE fully automated software for quantification of LV function.
HOW THREE-DIMENSIONAL ECHOCARDIOGRAPHY FULLY AUTOMATED SOFTWARE WORKS
Currently, there are two models of 3DE fully automated software available (eSie LVA™, Siemens Medical Solutions, Mountain View, California; and HeartModelAI, Philips Healthcare, Andover, Massachusetts, USA), both of which operate under the knowledge-based workflow. At the outset, while beginning to develop the auto-contouring programme, experts analysed and marked endocardial borders in >1,000 subjects with varying shapes of the left ventricle. This was used as a databank of different LV shapes.5 When this algorithm is used, the software locates the LV templates that best match the new LV volume and generates the endocardial contour. Before analysis, the end-diastolic volume (EDV) is determined from the R wave on the electrocardiogram and the end-systolic volume (ESV) from the frame with the minimal volume by motion analysis.5-7 3D LV rendering of LV casts, as well as time-volume curves, is then displayed with EDV, ESV, and EF (Figure 2). Manual editing of the LV endocardial border on apical cutting planes derived from the 3DE dataset is still allowed if the user is not satisfied with the automatically generated contours.
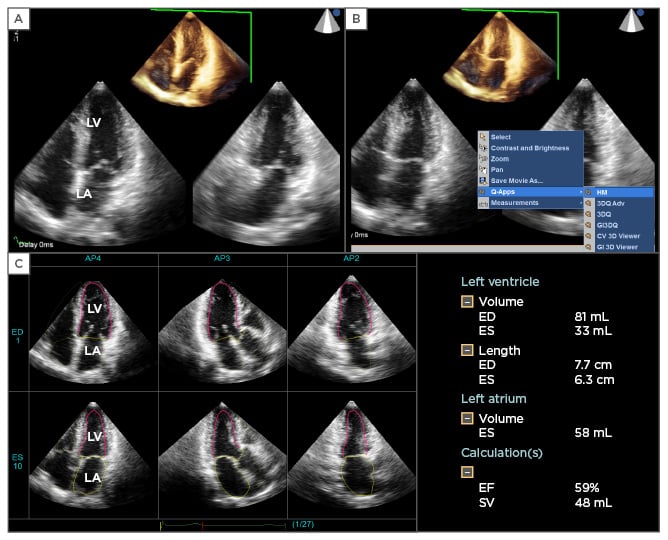
Figure 2: An example of the application of 3DE fully automated software.
A) Cropped one-beat 3DE full-volume image and two orthogonal 2DE cut images extracted from 3DE datasets. B) For the initiation of 3DE fully automated software, the examiner clicks the icon ‘Q-Apps’, and then selects ‘HM’. The software automatically runs for LV and LA border determination at end-diastole and end-systole. C) The final result is obtained within 30 seconds. The display shows three apical long axis views extracted from the 3DE datasets at end-diastolic and end-systolic frames. The pink line denotes the LV endocardial border, and the yellow line, the LA wall. The software provides LVEDV, ESV, and LVEF. It also measures LA volume at end-systole.
3DE: three-dimensional echocardiography; 2DE: two-dimensional echocardiography; LV: left ventricle; LA: left atrial; LVEDV: left ventricular end-diastolic volume; ESV: end-systolic volume; LVEF: left ventricular ejection fraction.
Accuracy of the Three-Dimensional Echocardiography Fully Automated Software
Current available validation studies utilising 3DE fully automated software show good-to-excellent correlation (correlation coefficient [r]=0.85–0.96) and acceptable accuracy compared to CMR imaging as a reference.5,7,8 Chang et al.5 performed a direct comparison of LV volumes and LVEF between 3DE with Siemens fully automated software and CMR in 91 patients, who were largely normal (38.5%) or having ischaemic cardiomyopathy (29.4%). There were 41 mL, 7 mL, and 8% underestimations against CMR with the corresponding 95% limit of agreement (LOA, 2 standard deviations): ±37 mL, ±33 mL, and ±13% for LVEDV, LVESV, and LVEF, respectively.5 The r value of LV parameters against CMR is 0.91–0.94. Thavendiranathan et al.7 validated LV volumes and LVEF utilising Siemens fully automated software against CMR in 67 patients with sinus rhythm. The correlation of LV parameters against CMR is excellent (r=0.90–0.98). Despite an under-estimation of LV volumes and LVEF (∆LVEDV, -18 mL, ∆LVESV, -10 mL, and ∆LVEF, -0.3%; 95% LOA: ±53 mL, ±36 mL, and ±5%, respectively), they also found that in the subgroup of patients with reduced LVEF (<50%), the accuracy of LV parameters reduced when compared to those with preserved LVEF (≥50%). The differences were -26 mL, -16 mL, and -0.2% for LVEDV, LVESV, and LVEF in patients with LVEF <50% and -11 mL, -4 mL, and -0.5% in those with LVEF >50%. Interestingly, Tsang et al.8 demonstrated similarly in their study that patients with impaired LVEF (<50%) had diminished accuracy for LV volumes and LVEF against CMR. The authors used another fully automated software (HeartModelAI, Philips) for LV quantification in 65 patients (60% with LVEF <50%). The correlation of LV parameters against CMR is good-to-excellent (r=0.85–0.93). In those with LVEF <50%, the differences between 3DE and CMR were -27 mL, -24 mL, and 2% for LVEDV, LVESV, and LVEF, whereas in those with LVEF >50%, the corresponding differences were smaller (-18 mL, 6 mL, and -9%, respectively). In the whole patient group, underestimation of LV volumes and LVEF against CMR was expected (-24 mL, -13 mL, and -2% for LVEDV, LVESV, and LVEF; LOA: ±50 mL, ±58 mL, and ±18%). The findings that the fully automated software did not work as well in patients with poor LV function may be due to the fact that reduced LVEF is usually associated with dilated left ventricle. In this situation, a 1 mm difference in tracing the border may lead to a larger volume error compared to a small or normal-sized left ventricle. Although 3DE fully automated software still underestimated LV volumes with a range between 18 mL and 41 mL of LVEDV and from 7–13 mL of LVESV compared to CMR, the bias was still smaller than the corresponding bias with use of the 3DE manual tracing method employed in the previous multicentre study (mean bias for LVEDV: 67 mL; LVESV: 41 mL).9 Most importantly, the observed bias between 3DE manual method and CMR differed significantly among four different institutions, probably due to differences between the behaviour of endocardial tracers.9
Another potential of this software is its high reproducibility. Intra and interobserver variability in LV volumes and LVEF was 0% when the fully automated software worked without any contour adjustment. Even though manual contour adjustment was required, the values were still <10% in contrast to 15–21% with the 3DE manual tracing method in the same 3DE datasets.8
As mentioned earlier, test-retest variability is the most important factor to evaluate serial changes in LV function. Although test-retest variability of the automated 3DE program did not reach 0%, the values showed a clinically acceptable range (6–8%) (Figure 3).
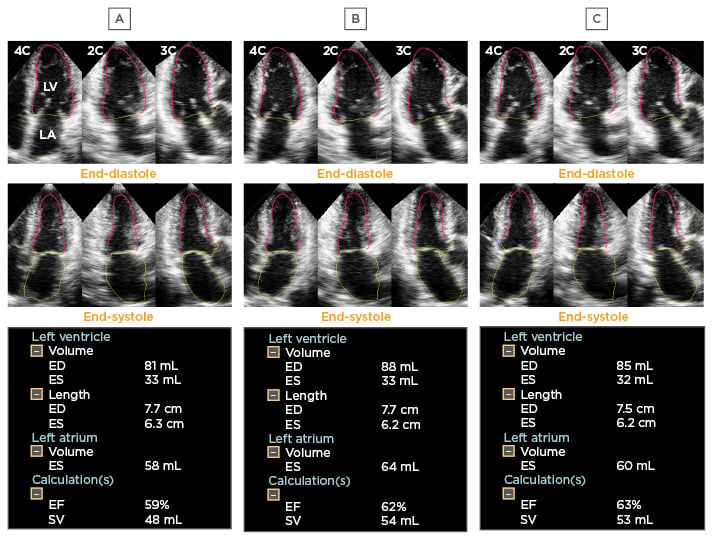
Figure 3: Test-retest variability.
Panel A to C indicates the final results of the fully automated software using different 3DE datasets acquired from the same patient. The software provided small but obviously different values of LV volumes and LVEF between three examinations.
3DE: three-dimensional echocardiography; LV: left ventricle; LVEF: left ventricular ejection fraction; ED: end-diastole; ES: end-systole; EF: ejection fraction; SV: systolic volume.
Advantages
From the same 3DE datasets, 3DE fully automated software provides equivalent LV volumes and LVEF among different observers regardless of their technical skill and expertise. Also, the time required for the analysis is much shorter (with or without contour adjustment, 76±6 and 26±2 seconds, respectively)8 than the traditional 3DE manual tracing method used by experts (144±32 seconds).9 Of note, in patients with LV aneurysms, traditional manual tracing may require an additional 5 minutes for analysis because the deformable shell does not work as well.10 In less experienced echocardiography labs, this fully automated software serves as an ideal option to obtain consistent and reliable LV measurements.
For patients who underwent 3DE, traditionally full-volume datasets for ≥4 cardiac cycles are acquired to ensure optimal spatial resolution with sufficient volume rate. For patients who cannot hold their breath adequately, or whose rhythm is irregular, multibeat data acquisition produces stitching artefacts resulting in unreliable assessment of LV function.7 To overcome this problem and widen the clinical adoption of 3DE imaging, acquisition of one-beat full-volume datasets with a relatively high-volume rate is now feasible. It is shown that the LVEF, EDV, and ESV obtained by manual tracing from one-beat acquisition are similar to that from four-beat acquisition with a high correlation.11 As the fully automated software only operates the one-beat 3DE full-volume dataset, its efficiency in data acquisition, and its accuracy and reproducibility is expected to be better than the manual tracing method.
With the introduction of innovative catheter-based technologies (PAVR, MitraClip, Abbot Laboratories, Lake Bluff, Illinois, USA), the treatment landscape for patients with severe AS and MR has been altered rapidly. In the geriatric population, physicians frequently need to deal with the clinical decision of when to refer non-operable or high-risk severe AS or MR patients for transcatheter intervention. Implantable cardioverter defibrillator and cardiac resynchronisation therapy and defibrillator rely on accurate LV function evaluation.12 With rising medical costs,13 it is essential to establish LV function unequivocally during close follow-up of such patients in order to allocate health resources wisely.
LV function analysis by 3DE eliminates the need for geometric assumptions, particularly in a deformed LV, and avoids measurement errors from a foreshortened left ventricle.14 The emergence of fully automated software for LV analysis might serve as a promising tool and solve previous problems with respect to reliability and reproducibility in 3DE analysis. Furthermore, it works rapidly and is no longer a researchers’ ‘toy’ but a useful tool for LV quantification in a busy clinical setting. This information can be incorporated into echocardiography reports and would serve as a reliable reference for interventional cardiologists in decision-making.
Clinical Application
It is common to find atrial fibrillation in patients with severe AS/MR and those on the waiting lists for implantable cardioverter defibrillator/ cardiac resynchronisation therapy and defibrillator. Accurate determination of correct LV function is paramount in this group. However, beat-to-beat variability of LV volumes and function results in inaccurate LV measurement in one single beat and thus, 4–17 beats analysis is usually recommended in LV analysis.15 Therefore, manual tracing in 3DE LV quantification could take ≤40 minutes, even for experts.8 In a recently published study utilising this fully automated software in patients with atrial fibrillation, the time spent for analysis in 10 consecutive cardiac cycles was 5 minutes versus 27 minutes by the manual tracing method. A comparison of LV mechanical parameters (LVEF, EDV, ESV) between fully automated software and the manual method showed a good correlation and minimal differences.16 Interestingly, the authors found that average values of LVEF, EDV, and ESV closely correlate to those obtained from the index beat with only a small bias. Since the index beat can be determined by calculating the preceding (RR1) and pre-preceding (RR2) R-R interval with the RR1/RR2 closest to 1.0, by using the fully automated software in an index beat, one can confidently infer that LV quantification will be accurate and representative.
CONCLUSION
With increased life expectancy, the number of non-operable and high-risk patients with severe valvular heart disease or those with heart failure is expected to grow. The advent of catheter-based technology has widened the treatment landscape. However, cost concerns highlight the importance of judicious implementation of expensive devices. LV quantification by echocardiography has an important role in the serial follow-up of patients and in clinical decision-making. Advances in ultrasound technology have helped to bring 3DE from bench-to-bedside, including improvements in high volume-rate one-beat full-volume acquisition and fully automated 3DE quantification software. Physicians or sonographers now have opportunities to produce TTE reports with reliable, reproducible, and rapid 3DE LV measurements not only in sinus rhythm, but also in those with an irregular rhythm. This fully automated quantification software for determining LV function also allows elucidation of the measurement differences of the sonographers in the decision making of the therapeutic management. This state-of-the-art technique, though still not perfect, will certainly be a valuable clinical tool for interventional cardiologists. Future prognostic studies incorporating measurements using this fully automated software are awaited.