Abstract
Background and Objectives: Fibrin sheath formation is a common cause of haemodialysis (HD) line dysfunction requiring frequent interventional line exchanges. This study assessed HD tip and line placement, line length, and demographics in poorly functioning HD lines due to fibrin sheath formation, to determine if there is a correlation between these factors and repeatedly poor function.
Patients and Methods: Patient medical records were retrospectively reviewed to include those who have had poorly functioning HD lines with fluoroscopic evidence of a fibrin sheath from 2011–2019. Analysis of variance and t-tests were performed to determine the significance of various factors on the time until a line exchange was required.
Results: Patients with an HD tip placed in the inferior vena cava underwent an exchange the soonest (130.23 days), while tips in the superior vena cava went the longest without required intervention (968.80 days; p=0.007). Lines in the left internal jugular vein had the most days without intervention, and lines in the femoral vein had the least (1,132.80 versus 142.50 days, respectively; p=0.007). Furthermore, 19 cm lines went 816.75 days without intervention, and 42 cm lines went 114.73 days without intervention (p=0.049). Intervention-free days decreased if the patient had undergone previous interventions (p<0.001). Patients with diabetes required intervention before those without diabetes (694.09 versus 917.08 days, respectively; p=0.033).
Conclusion: Factors such as HD tip and line placement, line length, previous interventions, and diabetic status demonstrated a correlation with how frequently tunnelled HD lines required intervention due to fibrin sheath formation.
Key Points
1. Identifying the most optimal location for haemodialysis (HD) tip placement could lead to future modifications in HD line insertion techniques and generate a way to reduce the migration of the tip once inserted.
2. Using an individualised approach for each patient on HD based on their comorbidities can be useful in being able to predict when an HD line may fail, and how soon after insertion it may require replacing.
3. Optimising both HD tip and line placement so that they will remain functional for longer before requiring replacement will cut down on overall costs for both patients and hospitals, and improve quality of life for patients.
INTRODUCTION
One of the most common causes of a poorly functioning haemodialysis (HD) line is the formation of a fibrin sheath.1-3 Tunnelled HD lines contain a Dacron® (Invista, Wichita, Kansas, USA) cuff at the skin entry site, which helps secure the catheter in place due to the fibrosis that occurs in the subdermal tissues.4-6 This fibrotic process results in the formation of a fibrin sheath, which forms at the cuff and grows centrally towards the tip of the catheter.7-8 This fibrin sheath can form as early as 24 hours, and begins as platelet aggregation followed by fibroblast conglomeration.9-11 When the fibrin sheath reaches the tip or inner lumen of the catheter, flow can be impeded. HD dysfunction due to fibrin sheath formation has been reported in 13–57% of patients on HD.12-14 The fibrin sheath formation additionally acts as a nidus for biofilm formation and infectious complications.15-17 These sheaths consist of various histological components, such as smooth muscle cells, collagen cells, thrombi, and endothelial cells, which hinders possible treatment and prophylactic options.18-20 Current prophylactic measures with novel materials and coatings, such as heparin, do not entirely prevent fibrin sheath formation, and treatment options are limited and costly.15,21,22
The purpose of this study was to enhance future knowledge on patients on HD, how often their tunnelled HD lines require intervention due to fibrin sheath formation, and if there are any correlations in which patients require more frequent interventions, specifically over-the-wire balloon disruption of the fibrin sheath and line exchange. The variables tested included demographics, other comorbidities, length of HD line used, and HD tip and line placement. The most optimal anatomical location for the HD line tip has been extensively reviewed over the years as proper tip position is essential for efficient HD, with continuing debate on which position has the lowest risk of complications between the right atrium (RA), cavoatrial (CA) junction, and superior vena cava (SVC).23-25 Current techniques aim for tip insertion in the middle of the RA, but migration after insertion is common.26-28 The right internal jugular vein (IJV) has been the optimal location for line placement, with femoral and subclavian vein lines used less frequently due to the increased risk of thrombosis and infection.25,29,30
The study also aimed to investigate if those who have already had HD line dysfunction due to fibrin sheath formation are more prone to repeat events. There has been evidence that despite intervention by removal of the catheter, remnants of the fibrin sheath can persist in the venous system.18,31,32 Although noted to be a rare complication, it may be an overlooked complication, as it is often found incidentally on subsequent CT scans and echocardiography.31,33,34 Calcified remnants of a fibrin sheath are also often overlooked and misdiagnosed as HD line fractures on imaging.32,35
Diabetes has also been associated with HD line dysfunction.36,37 This has been attributed to the fact that a chronic hyperglycaemic state increases oxidative stress and inflammation, which contributes to a hypercoagulable environment that can cause fibrin sheath formation.38,39
METHODS
This retrospective study consisted of 299 consecutive patients from 2011–2019 at a single community hospital who were booked for HD line exchange/fibrin sheath disruption for a poorly functioning HD line, including 162 males and 137 females. Enrolment criteria included males and non-pregnant females over the age of 18 years with clinical evidence of poor HD flows in at least one of the two lumens and fluoroscopic evidence of a fibrin sheath on digital subtraction angiography. Patients with unknown fibrin sheath status were excluded from the study. Meditech (Westwood, Massachusetts, USA) was used to access medical records, including patient demographics and procedure dates. IMPAX (Mortsel, Belgium) was used to access imaging records to confirm HD tip placement. The total number of line exchanges and the time from initial line insertion to when an exchange was required were recorded for each patient. The time intervals between the first three interventions were also recorded for those applicable to investigate if interventions became more frequent after a line exchange occurs.
Fibrin sheath disruption and HD line exchanges were all performed under sterile conditions in the angiography suite by fellowship-trained interventional radiologists. Fibrin sheaths were confirmed by bluntly dissecting the catheter, withdrawing them over a wire, and performing digital subtraction angiography. All HD lines were non-coated HemoStar™ (Bard, New Providence, New Jersey, USA) catheters.
The median age of the study group at the time of their first HD line insertion was 64 years. Other demographic data were also recorded to evaluate if those factors had an impact on line exchanges.
Out of all of the patients, 160 (55%) had diabetes, 17 (6%) were current smokers, 30 (10%) were ex-smokers, 240 (82%) had diagnosed hypertension, 41 (14%) had coronary artery disease, and 87 (30%) had hyperlipidaemia. Of those with diabetes, 140 (88%) also had co-existing hypertension.
HD line characteristics recorded included tip placement, line placement site, and length of line. Intervention fluoroscopy time was also recorded, with a mean time of 1.03 minutes (standard deviation [SD]: 1.71). The possible tip placement positions included the CA junction, RA, SVC, and inferior vena cava (IVC). In total, 56% of the patients had their HD tip placed in the RA, 28% had theirs placed in the SVC, 12% had theirs placed in the CA junction, and 4% had theirs placed in the IVC. The various line placements were the right subclavian vein, right IJV, common femoral vein, and left IJV. The majority of HD lines (85%) were in the right IJV, with 7% placed in the left IJV, 5% placed in the femoral vein, and 2% placed in the right subclavian vein. The majority of HD lines were either 19 cm or 23 cm in length (42% and 50%, respectively), with 4% of lines being between 27–33 cm, and another 4% being >42 centimetres in length.
The variables tested included gender, age at initial insertion, smoking status, intervention fluoroscopy time, and whether the patient had hyperlipidaemia, coronary artery disease, diabetes, or hypertension.
T-tests were used to determine if any of the variables had an impact on either the number of exchanges performed or the length of time until an exchange was required. Analysis of variance (ANOVA) tests were then performed to determine if HD line tip or line placement had an effect. Variables that proved to have a significant impact in the t-test were then grouped separately for further ANOVA tests on tip placement and line placement.
RESULTS
The initial ANOVA test comparing tip placement and length of time between HD line insertion and intervention produced the following results represented by the mean: CA junction: 632.82 days (SD: 747.96); IVC: 130.23 days (SD: 147.89); RA: 798.51 days (SD: 837.73); and SVC: 968.80 days (SD: 1,006.69); with p=0.007 for this ANOVA.
The initial ANOVA test comparing line placement and length of time between line insertion and intervention yielded the following results represented by the mean: femoral vein: 142.50 days (SD: 133.53); left IJV: 1,132.80 days (SD: 1,380.28); right IJV: 804.42 days (SD: 841.00); and right subclavian vein: 921.86 days (SD: 519.59); with p=0.007 for this ANOVA.
The percentage of HD lines that remained functional at 6 months, 1 year, and 2 year intervals is illustrated in Table 1.
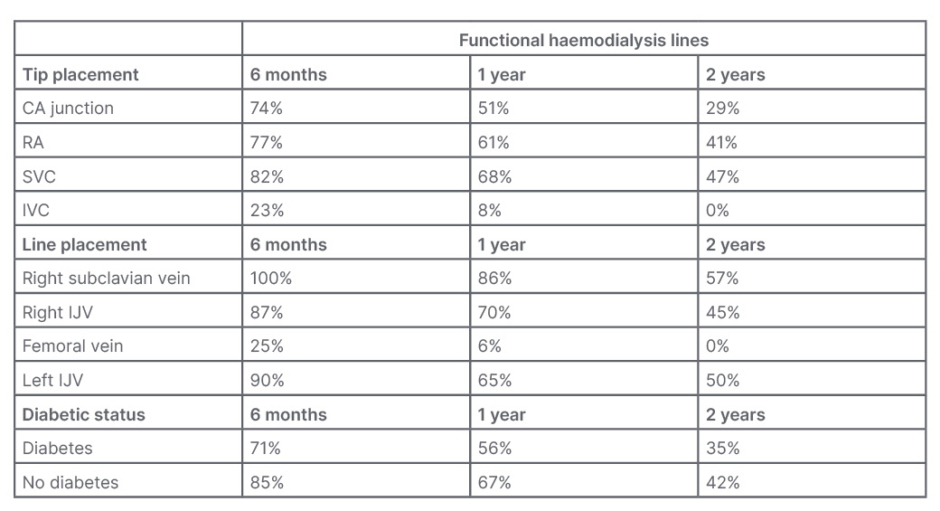
Table 1: Percentage of haemodialysis lines that remained functional.
CA: cavoatrial; IJV: internal jugular vein; IVC: inferior vena cava; RA: right atrium; SVC: superior vena cava.
The ANOVA testing the length of the HD line to time until required intervention yielded the following results: 19 cm: 816.75 days (SD: 839.18); 23 cm: 790.71 days (SD: 898.57); 27–33 cm: 458.70 days (SD: 406.20); and >42 cm: 114.73 days (SD: 84.42); with p=0.04 for this study.
The length was then also compared with tip placement by calculating the intervention-free days per cm of line and separating by tip placement. When comparing the two factors using an ANOVA the following results were produced: CA junction: 31.42 days/cm (SD: 36.52); IVC: 4.64 days/cm (SD: 6.78); RA: 35.73 days/cm (41.18); and SVC: 44.31 days/cm (SD: 42.71); with p=0.049.
The ANOVA test comparing the time intervals between the first three interventions produced the following results represented by the mean: line insertion to intervention: 798.45 days (SD: 876.90); first–second intervention: 556.52 days (SD: 584.90); and second–third intervention: 364.96 days (SD: 408.79); with p<0.001.
The ANOVA test comparing tip placement and the mean number of interventions required provided the following results represented by the mean: CA junction: 2.77 days (SD: 2.28); IVC: 2.30 days (SD: 1.44); RA: 2.52 days (SD: 1.91); and SVC: 3.07 days (SD: 2.68); with p=0.15.
The t-tests comparing the length of time between initial line insertion and intervention yielded the following results represented by the means: female gender: 841.64 days (SD: 907.04), and male gender: 762.47 days (SD: 852.14), with p=0.442; age 64 years and below: 886.81 days (SD: 1,434.00), and age 65 and over: 707.08 days (SD: 621.06), with p=0.075; smoking status: non-smoker: 818.63 days (SD: 886.93), and smoker: 691.15 days (SD: 822.24), with p=0.339; blood pressure: no hypertension: 819.45 days (SD: 1,069.19), and hypertension: 791.50 days (SD: 824.86), with p=0.854; diabetic status: no diabetes: 917.08 days (SD: 1,037.64), and diabetes: 694.09 days (SD: 692.81), with p=0.033; no coronary artery disease: 786.58 days (SD: 874.31), and coronary artery disease: 877.03 days (SD: 901.52), with p=0.560; no hyperlipidaemia: 850.02 days (SD: 965.84), and hyperlipidaemia: 673.99 days (SD: 597.91), with p=0.058.
All t-tests testing for any correlation with the number of interventions required produced insignificant values of p>0.05.
After the t-tests, patients were further separated into groups with diabetes and without diabetes, and the ANOVA tests that produced significant results were conducted again.
In patients with diabetes, the ANOVA comparing HD line tip placement and length of time between line insertion and intervention produced the following results represented by the mean: CA junction: 455.24 days (SD: 375.79); RA: 742.52 days (SD: 632.97); SVC: 817.55 days (SD: 632.97); and IVC: 135.70 days (SD: 176.84); with p=0.015.
In patients without diabetes, the ANOVA comparing HD line tip placement and length of time between line insertion and intervention produced the following results represented by the mean: CA junction: 810.41 days (SD: 972.43); RA: 860.18 days (SD: 910.52); SVC: 1,135.18 days (SD: 1,293.57); and IVC: 112.00 days (SD: 63.31); with p=0.264.
In patients with diabetes, the ANOVA comparing HD line location and length of time between line insertion and intervention produced the following results represented by the mean: right subclavian vein: 777.50 days (SD: 526.80); right IJV: 694.05 days (SD: 627.23); femoral vein: 149.92 days (SD: 152.55); and left IJV: 1,257.91 days (SD=1,266.78); with p=0.002.
In patients who did not have diabetes, the ANOVA comparing line location and length of time between line insertion and intervention produced the following results represented by the mean: right subclavian vein: 1,114.33 days (SD: 544.41); right IJV: 922.93 days (SD: 1,011.44); femoral vein: 120.25 days (SD: 54.27); and left IJV: 979.89 days (SD: 1,571.96); with p=0.395.
In patients with diabetes, the ANOVA comparing the time between the first three interventions yielded the following results represented by the mean: line insertion to first intervention: 694.09 days (SD: 692.81); first–second intervention: 551.59 days (SD: 617.86); and seocnd–third intervention: 375.09 days (SD: 421.16); with p=0.002.
In patients without diabetes, the ANOVA comparing time between the first three interventions yielded the following results: line insertion to first intervention: 917.08 days (SD: 1,037.63); first–second intervention: 562.73 days (SD: 547.27); and second–third intervention: 350.11 days (SD: 394.16); with p<0.001.
The results of the tests on patients with diabetes versus without diabetes are illustrated in Table 2.
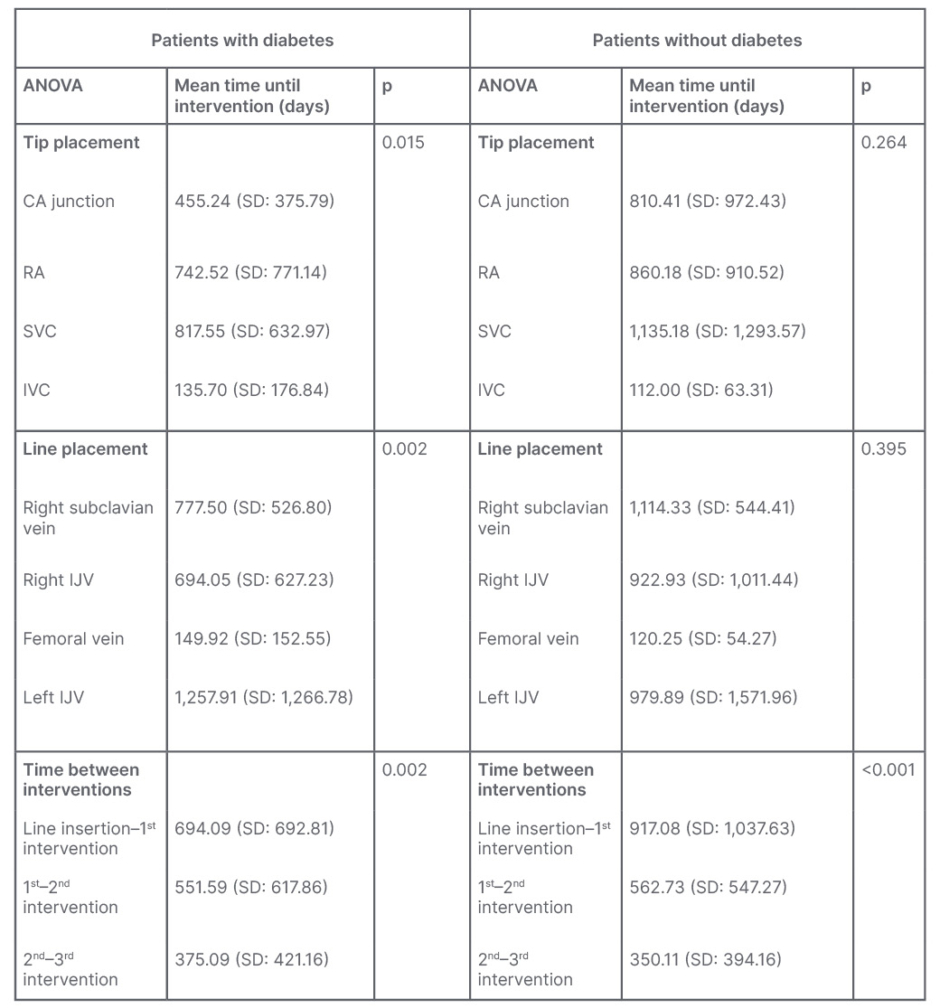
Table 2: Analysis of variance tests in patients with diabetes versus without diabetes.
ANOVA: analysis of variance; CA: cavoatrial; IJV: internal jugular vein; IVC: inferior vena cava; RA: right atrium; SD: standard deviation; SVC: superior vena cava.
ANALYSIS
There was statistical significance (p<0.05) in the relationships between both HD line tip placement and line placement in regards to the time from HD line insertion until an intervention was required. Patients who had their HD tip placed in the SVC had lines that remained functional the longest, with an average time of 968.80 days until intervention was required, which differs from the current technique that aims for insertion in the RA. The second most optimal location for tip placement was the RA, with an average of 798.51 days until required intervention. Patients with HD line tips that were placed in the CA junction required HD line exchanges at an average of 632.82 days. Patients with their HD tip placed in the IVC required an intervention the soonest, with an average of 130.23 days between line insertion and intervention. The HD lines placed in the left IJV remained functional the longest, with an average of 1,132.8 days. The 2% of patients with HD lines in the right subclavian vein went an average of 921.86 days before requiring intervention. The majority of patients had their HD lines placed in the right IJV, which had an average time of 804.42 days between insertion and exchange. Those with the line running through the femoral vein required intervention after an average of only 142.5 days. A correlation was most likely seen between femoral vein lines and IVC tip placement requiring earlier intervention due to the tip of femoral vein lines almost always being placed in the IVC and it being a last-resort option for permanent HD access, suggesting that patients with lines in the femoral vein have all most likely had previous lines elsewhere that failed and have possible damage to those veins.23,30
When comparing the length of HD lines and days without intervention, the shorter 19 cm and 23 cm lines went a longer time without required intervention compared with the longer 27 cm and 42 cm lines (p=0.04). This may be heavily affected by the location where these lines are placed. While the 19 cm and 23 cm lines are typically placed in the right IJV, the >42cm lines are placed in the femoral vein, which tends to require intervention sooner.
The ANOVA test comparing the average time between the first three exchanges also proved to be highly significant (<0.001), with the duration of time between exchanges decreasing as the number of exchanges increases. The exact mechanism by which HD dysfunction due to fibrin sheath formation occurs sooner in those who had previous fibrin sheath formation is most likely due to a multitude of factors that can be explored in future studies. It is possible that some of these patients retained remnants of the fibrin sheath after removal of their original HD line that contributed to future HD line dysfunction, although further research would be required to confirm this.18,31,33
The total number of exchanges a patient underwent had no significant correlation (p>0.05) with HD tip placement, line placement, health conditions, or demographics. This number is influenced by alternative factors such as patients receiving kidney transplants, death, and the fact that some patients have had an HD line much longer than others.
The only patient factor that had a statistically significant effect on the time until the first intervention was diabetic status (p=0.033), with patients with diabetes requiring an intervention an average of 222.99 days sooner than those without diabetes. This is likely due to the increased inflammation seen in patients with diabetes due to chronic hyperglycaemia.38 No significant correlation was found between fibrin sheath formation and smoking status, age at insertion, gender, hyperlipidaemia, hypertension, or coronary artery disease in this study.
When separated, the group with diabetes produced a similar pattern of results as all the initial significant ANOVA tests comparing tip placement, line placement, and time between interventions with significant values (p<0.05). The lines with the HD line tip placed in the SVC remained functional the longest, followed by tip placement in the RA, then the CA junction, and finally the IVC. However, the group without diabetes also yielded similar results, but an insignificant p-value (p=0.264) in the ANOVA comparing tip placement and time until an exchange was required. The results of the initial line placement and time until intervention ANOVA produced different results than the initial test and an insignificant p-value (p=0.395). Regarding the time between interventions, both the group with diabetes and without diabetes produced similar results as the initial ANOVA with highly significant results (p=0.002 and p<0.001, respectively). Both groups demonstrated a decrease in time between interventions for the first three interventions. It is a possibility that the smaller sample size of the group without diabetes may have contributed to insignificant results as the majority (55%) of the group had diabetes.
LIMITATIONS
Possible sources of error in this study include human error in reading the imaging for HD tip placement and errors in information retrieval from patient records. An additional source of possible error is that line exchanges that were performed at other hospitals for these patients could have remained unrecorded in patient files in the Scarborough Health Network (SHN). Patient demographics and health information that were not recorded in patient notes are another possible source. A larger sample size of patients in each variable tested would additionally benefit the validity of this study, as there was an unequal distribution of patients in each test group. Despite a significant p-value, 85% of the patients had their HD lines placed in the right IJV, meaning a larger sample size of patients with alternative line placements would be required to confidently report findings on the effect of line placement on HD line function.
This sample size was insufficient to compare both combined HD line tip and line placements. The year that each HD line was inserted was also not taken into account in this study, which has had an effect on HD line failure in previous studies.40 Alternative factors not tested in this study could also have a possible effect on HD dysfunction and fibrin sheath formation, and hence, the results of this study.
CONCLUSION
With millions of people on dialysis worldwide, having the ability to predict the frequency at which tunnelled HD lines will need to be exchanged due to fibrin sheath formation would allow for both physicians and patients to have a better understanding of individualised HD care. In this study, HD line tip placement, line placement, line length, and diabetic status of a patient all had an impact on the dysfunction of HD lines and when an interventional line exchange was required. Tip placement in the IVC, line placement through the femoral vein, and having diabetes were factors that required patients to have more frequent interventions due to poor patency, while patients with tip placement in the SVC and line placement through the left IJV required interventions the least frequently. This challenges the current regimen used of aiming to insert the tip into the RA via the right IJV.
The longer 27 cm and 42 cm lines required an earlier intervention than the 19 cm and 23 cm lines, although the associated line placement could be affecting these results. Tip and line placement proved to be effective predictors, specifically in patients with diabetes. Once a patient had at least one intervention performed, subsequent interventions were required at more frequent intervals for the first three exchanges in this study. None of the variables tested in this study displayed a pattern that could be used to predict the total number of interventions that would be required. Current evidence supports the findings of poorer patency in patients with diabetes and those with HD lines in the femoral vein. Larger studies are required to confirm the findings on how catheter tip placement impacts the frequency of interventions on tunnelled HD lines. Prospective studies conducted in the future could be used to confirm these findings of which tip and line placement have the best outcomes, as well as the impact other patient factors may have on line dysfunction, in order to optimise line insertion techniques. Future studies with a more significant sample size should be used to demonstrate any correlation when comparing both tip and line placement.