Abstract
Background: Several environmental studies have reported that low-level exposure to nephrotoxic elements increases the risk of chronic kidney disease (CKD). In developing countries, finite resources can limit epidemiological studies and environmental risk assessment; however, the unique soil profile in Jamaica has raised some concerns for the potential exposure to populations who are of high risk.
Method: This study investigated the potential for using trace element profiling in CKD, by analysing blood concentration levels of vanadium, chromium, iron, cobalt, copper, zinc, selenium, strontium (Sr), arsenic, barium, cadmium, mercury, and lead. Trace element analysis was conducted using inductively coupled plasma mass spectrometry.
Results: One hundred and fifty-eight individuals were included and were predominantly of African descent (98%) and their ages ranged from 21 to 90 years old. Three main correlation clusters were evident: firstly, vanadium, chromium, copper, silicon, and selenium, with mercury and barium more distantly related; secondly, lead, arsenic, nickel, and Sr; and thirdly, iron and zinc. Cadmium was an outlier. Blood Sr was strongly associated with estimated glomerular filtration rate (r = -0.83; p<0.001) and strong linear progression models (r2=0.96; p<0.001). Algorithmic models placed Sr as the highest-ranking trace element biomarker (area under the curve: 95.6%; p<0.001).
Discussion: The decline in kidney function may result in the retention of non-essential trace elements. Strong corresponding trends between kidney function and blood Sr concentration indicate biomarker potential for a trace element with a unique profile in patients with CKD. Other significant relationships may also be unveiled as CKD biomarkers as trace element profiling is explored in the region.
INTRODUCTION
The global epidemic of diabetes and hypertension continues to foster the rapid increase of chronic kidney disease (CKD), which has an estimated prevalence of 13.4% worldwide.1 The Caribbean region situated between the Americas is as vulnerable to these disease trends as anywhere else. In Jamaica, which is the largest English-speaking Caribbean island, the prevalence of diabetes and hypertension is 30% and 35%, respectively.2 At least 150,000 Jamaicans have been estimated to be living with some form of kidney disease, of which approximately 2,700 are cases of CKD.3,4
The island is unique in that it contains significantly high levels of cadmium (Cd) soil reservoirs, with the highest levels registered at 409 mg/kg. These levels are more than the world’s mean soil measurements, which range from 0.005 to 2.900 mg/kg.5 Environmental studies carried out by the International Centre of Environmental and Nuclear Science, Kingston, Jamaica, detailing the bioaccumulation in staple foods of the Jamaican diet such as sweet potatoes, ginger, and rice, demonstrate the potential exposure pathways for toxic element exposure.6-8 Biopsy studies have revealed the deposition of toxic metals in the kidney and liver of cattle reared in those areas.9 The purported link of Cd to kidney disease, as well as the resurgence of industrial mining in recent times, has spurred interest in trace element analysis and related chronic diseases on the island.
Since the discovery of aluminium-induced neurological and bone disease in patients receiving dialysis, trace elements have been studied in relation to kidney disease and therapy.10,11 Other studies suggest an increased risk of CKD, hypertension, and diabetes by virtue of low-level chronic exposure to toxic metals.12,13 However, few environmental studies have evaluated element trends and their relationship to CKD in black ethnic groups even in international studies, despite the disproportionate burden of CKD that has been highlighted in these populations.14 In low-income countries, such an undertaking is of low priority due to lack of financial resources and/or relevant infrastructure.
Trace elements are ubiquitous entities and a fair number of non-essential xenobiotics gain entry into the body via a multitude of ways, including through groundwater (arsenic, strontium, silicon), inhalation of silica dust (silicon), gasoline (lead), cigarette smoke, and soil (cadmium) and food contamination (arsenic, mercury).15 Ordinarily, inadvertent intake of non-essential trace elements is neutralised by excretory pathways, and nascent biomolecular mechanisms reduce the likelihood of protracted renal exposure. However, the reduction of renal clearance will likely lead to the progressive accumulation of these non-essential elements in patients with CKD.16 Dietary restriction introduced for the management of CKD may further potentiate exposure to non-essential trace elements that are found in high concentrations in the recommended food groups.17 The propensity for xenobiotic elements to interfere with cellular processes, inducing cytotoxic responses and causing localised tissue injury while supplanting essential elements and reducing reparatory function, can further exacerbate the metabolic milieu commonly associated with complications of CKD.18,19 The aim of this study was to investigate the trace element profile for Jamaican patients with CKD.
MATERIALS AND METHODS
Ethical Statement
Approval was granted in 2016 from the Medical Ethics Committee of The University of the West Indies, from the Ministry of Health, and from the relevant municipal health agencies. Procedures followed were in compliance with the Declaration of Helsinki 1975, as revised in 2013.
Population
A cross-sectional study was carried out between 2016 and 2019 in Jamaica. Patients with CKD from three major renal clinics in Kingston, St. Ann Parish, and Manchester Parish were recruited; the Kingston clinic receives intake of patients from the southeast region of the island, while the other two clinics receive intake from the northeast and southern regions, respectively. All attendees at the respective clinics were approached and given equal opportunity to participate in the study; however, patients who did not meet inclusion criteria requirements were immediately eliminated from the sample population. Sixty-eight patients with Stage 5 CKD on haemodialysis (CKD-HD) and 61 patients with CKD from Stage 1 to 4 gave prior informed consent to participate in the study and were interviewed. Subsequently, 29 volunteers who did not have CKD were recruited by convenience sampling and gave prior informed consent and were interviewed. Of the eligible candidates, 96 study participants submitted fasting venous blood samples for trace element analysis.
Selection Criteria and Outcomes
The estimated glomerular filtration rate (eGFR) was calculated using the CKD Epidemiology Collaboration formula. CKD, according to Kidney Disease Increasing Global Outcomes (KDIGO) guidelines, is defined as kidney damage (structural or functional) for >3 months with a loss of glomerular function or an eGFR <60 mL/min/1.73 m2 and/or the presence of albuminuria (>30 mg).20 Patients were classified Stage 1–4 according to KDIGO guidelines. End-stage renal disease (ESRD)/CKD-HD Stage 5 represented in this study was classified as having an eGFR <15 mL/min/1.73 m2 and receiving renal replacement therapy (haemodialysis; HD).20,21
A priori evaluation of the subjects without CKD was guided by the following criteria: 21 years of age and older; living in Jamaica for at least 6 months with no known history of irregular elemental exposure through occupation or association; and in good health (on declaration and confirmed by follow-up medical evaluation). Volunteers who reported heavy drinking, smoking, or heavy mineral supplementation were excluded from this cohort. Of the 29 self-declared non-CKD group, 24 participants were eligible and fell within the reference ranges for systolic and diastolic pressure and renal function indices.
Sample Collection and Handling
Special care was taken to avoid entry of external contaminants into the blood samples. Blood was extracted into trace-element-free tubes (K2EDTA BD vacutainer, 4.0 mL). For patients with CKD-HD Stage 5, blood extraction was conducted pre- and post-HD. To reduce additive effects, antiseptic agents containing betadine and iodine derivatives were avoided during sample extraction. Powder-free sterile gloves and 70% isopropyl alcohol were used during sample extraction and handling. Specimens were stored at -80 °C until analysis. Serum samples were also withdrawn and submitted for routine biochemical analyses, including serum creatinine.
Sample Preparation and Elemental Analysis
All vials and tubes during sample processing were acid washed overnight with 1% nitric acid (HNO3) and rinsed with deionised water. For acid digestion, trace metal grade concentrated HNO3 was submitted to sub-boiling distillation to produce high-purity HNO3. Element-free propylene tubes were used. 2.0 mL of HNO3 was added to 0.1 mL of blood in a Teflon vial and digested overnight on a hotplate at 100 °C, evaporated to incipient dryness, and redissolved in 2% HNO3. Samples were analysed by inductively coupled plasma mass spectrometry on an Agilent 8800 ICP-QQQ (Agilent, Santa Clara, California, USA) for iron (Fe), zinc (Zn), silicon (Si), vanadium (V), chromium (Cr), cobalt (Co), nickel (Ni), copper (Cu), arsenic (As), selenium (Se), strontium (Sr), Cd, barium (Ba), mercury (Hg), and lead (Pb). For ease of discussion, trace elements were grouped as essential and non-essential.
Clinical Evaluation
Demographic data and medical history were elicited by assisted interview. Physical examination was carried out by trained personnel to acquire anthropometric measurements and blood pressure (BP). Biochemical analysis was also performed to establish renal function, and the eGFR was calculated using the CKD Epidemiology Collaboration formula.
Statistical Analysis
Statistical analysis was performed using Statistical Packages for Social Sciences (SPSS®; IBM®, Armonk, New York, United States) software. Baseline clinical characteristics were calculated using the Student’s t test for continuous variables. The difference between the non-CKD, CKD Stage 1–4, and ESRD groups was analysed using Kruskal–Wallis test. Statistically significant trace element features were identified by evaluating element concentration and trends based ondiagnosis and severity of CKD. The intradialytic efficacy of the HD process was obtained by finding the difference between the pre- and post-HD blood concentration of participants with Stage 5 CKD undergoing chronic dialysis (CKD-5D):
% Difference = – (PreHDconc.- PostHDconc.)/(PreHDconc.)*100
Spearman’s correlation was used to evaluate correlations between trace element levels and age, serum creatinine, and eGFR. For the patients with Stage 5 CDK-HD, trace element correlations with length of HD sessions were also obtained. Partial correlations were adjusted for age and systolic BP to determine associations between trace elements, serum creatinine, and eGFR.
Using MetaboAnalyst 4.0, trace element data were log-transformed and auto-scaled by mean-centring and adding the standard deviation of each variable. Three algorithms, including support vector machines, partial least-squares discriminant analysis, and random forest, were used to generate models to identify the most significant trace element features. Multivariate logistic regression models were then constructed using the derived trace element features in models adjusted for age, sex, and hypertension. A p value of <0.05 was considered statistically significant.
RESULTS
Study Population
Study participants were predominantly of African descent (98%). The average age of the study participants was 51 years (range: 20–90). The average systolic BP of the study population was 146 mmHg (range: 96–235). The mean age, systolic BP, and blood glucose were highest among patients with Stage 5 CKD as compared to other study participants. In the study overall, there was an equal male–female distribution (50% each); however, there was a larger female representation within CKD Stages 1–4, while males accounted for twice the number of females in the CKD-5D group. Hypertension was the most common comorbidity for patients with CKD (87%), followed by diabetes (38%). Of the patients with CKD-5D, 85% attended bi-weekly dialysis sessions, 13% attended dialysis sessions three days per week, and 2% attended only one dialysis session per week.
Trace Element Analysis
Blood Sr levels progressively increased with declining kidney function (p<0.001). Table 1A shows other elements such as Cd (highest), Ba, and Si (lowest) in the patient group with CKD Stages 1–4 (p<0.001) as compared to the other groups; the table also shows Fe and Zn (highest), and Co (lowest) in the patient group without CKD as compared to the other groups (p<0.001). Linear progression models for geometric mean blood concentration for the first four stages of CKD produced a strong linear progression for Sr (r2=0.96), and moderate/mild linearity for Si (r2=0.65), Fe (r2=0.63), Cd (r2=0.63), Co (r2=0.58), Ba (r2=0.53), and Cr (r2=0.51). However, most elements fit a polynomial trend better: Cu (r2=31), As (r2=0.16), Hg (r2=0.15), Se (r2=0.13), Zn (r2=0.10), V (r2=0.10), Pb (r2=0.04), and Ni (r2=0.00).
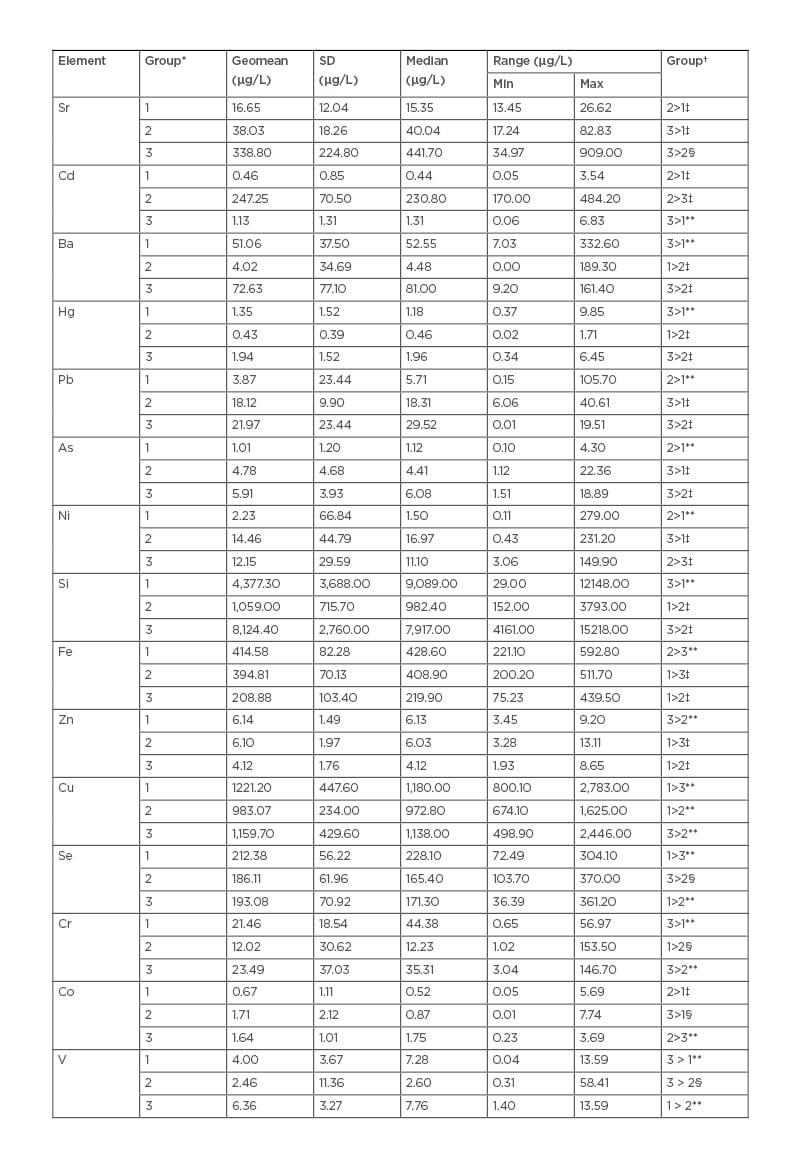
Table 1A: Trace element concentrations in whole blood for study participants.
*Group 1: no CKD; Group 2: CKD Stage 1–4; Group 3: CKD Stage 5.
†Group comparison; group comparisons have an adjusted p value.
‡adjusted p value <0.001.
§adjusted p value <0.05.
**adjusted p value: no significance.
As: arsenic; Ba: barium; Cd: cadmium; CKD: chronic kidney disease; Co: cobalt; Cr: chromium; Cu: copper; Fe: iron; Hg: mercury; Ni: nickel; Pb: lead; Se: selenium; Si: silicon; Sr: strontium; V: vanadium; Zn: zinc.
The following non-essential elements showed significant intradialytic changes: decreased As (46%; p<0.001) and increased Sr (56%; p<0.001). There was no significant difference in the mean essential trace element levels pre- and post-HD; however, Sr (r=0.362), Se (r=0.374), Pb (r=0.321), and Co (r=0.369) showed significant positive associations with length of HD in post-HD samples. Similarly, patients on thrice-weekly dialysis sessions were more likely to have increased Sr levels (r=0.273) compared to other patients on HD.
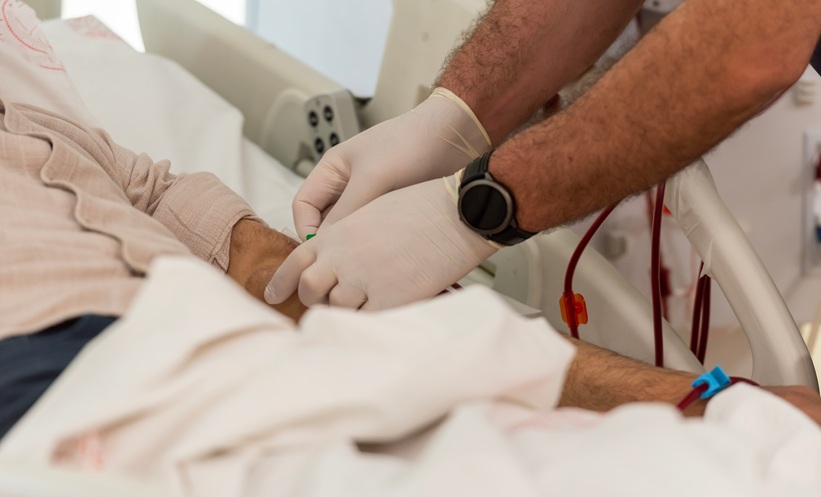
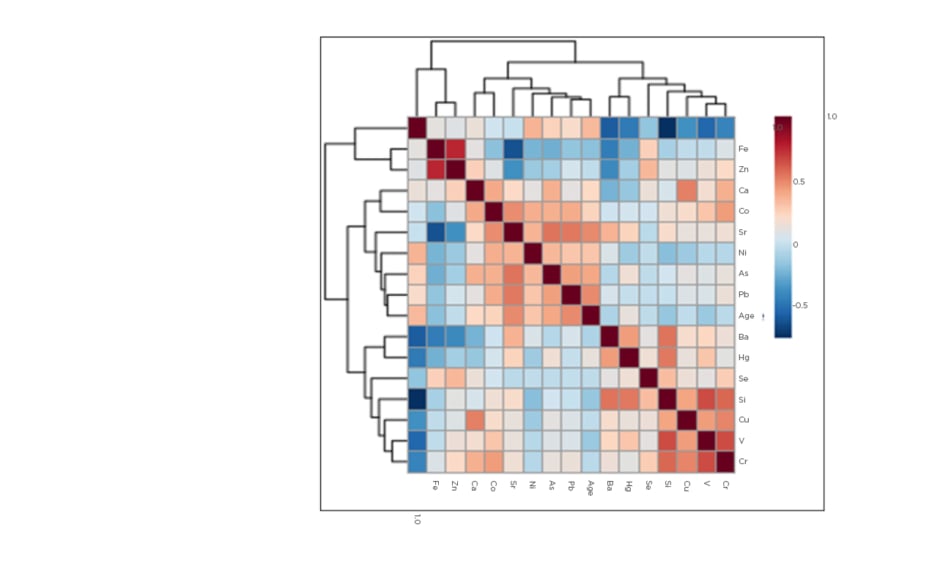
Figure 1 shows the correlations between various trace elements and age. Three main correlation clusters were evident: firstly, V, Cr, Cu, Si, and Se, with Hg and Ba more distantly related; secondly, Pb, As, Ni, and Sr; and thirdly, Fe and Zn. Cd was an outlier. The first two clusters were more closely related than the third. Blood Sr was positively correlated with several non-essential elements including As (r=0.560; p<0.001) and Pb (r=0.550; p<0.001), but negatively correlated with essential elements such as Fe (r=-0.590; p<0.001) and Zn (r=-0.350; p<0.001). As a general finding, essential trace elements correlated positively with each other and negatively with non-essential elements. The exception to this trend was observed with Co, however, which correlated significantly with several non-essential elements including Pb, As, and Sr. The strongest correlations were observed between Fe and Zn (r=0.770; p<0.001), and Cd and Si (r=-0.720; p<0.001). The highest negative correlation was found between eGFR and Sr (r=-0.830; p<0.001). This significant correlation persisted after adjusting for age and systolic BP (r=-0.580; p<0.001). Non-essential metals such as Pb, Ni, As, and Hg all showed inverse association with eGFR, unlike Fe and Zn, which showed positive association. However, As (r=-0.403; p<0.001), Pb (r=-0.280; p<0.05), Fe (0.569; p<0.001), and Zn (0.301; p<0.05) remained significant after adjusting for age and systolic BP. Serum creatinine showed inverse relationships to Fe (r=-0.650; p<0.001) and Zn (r=-0.390; p<0.05), but a positive association with Sr (r=0.720; p<0.001) after adjusting for age and systolic BP.
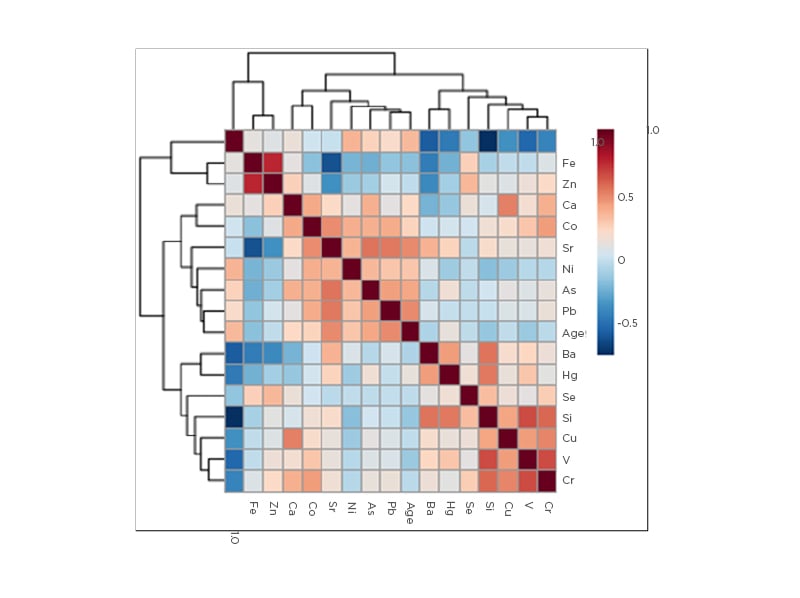
Figure 1: Heat map denoting correlations between age and trace elements.
As: arsenic; Ba: barium; Ca: calcium; Cd: cadmium; Co: cobalt; Cr: chromium; Cu: copper; Fe: iron; Hg: mercury; Ni: nickel; Pb: lead; Se: selenium; Si: silicon; Sr: strontium; V: vanadium; Zn: zinc.
All three algorithmic models ranked Sr in the top tier of the trace element profile. Further logistic regression analyses performed using partitioning of eGFR <60 mL/min/1.73 m2 (Table 1B) and eGFR <45 mL/min/1.73 m2 affirmed a significant association between CKD diagnosis and increased blood Sr levels. A receiver operator curve derived for Sr (Figure 2) showed the best cut-off for a CKD diagnosis at a Sr concentration of 22.90 µg/L (p<0.0001; standard error: 0.023).
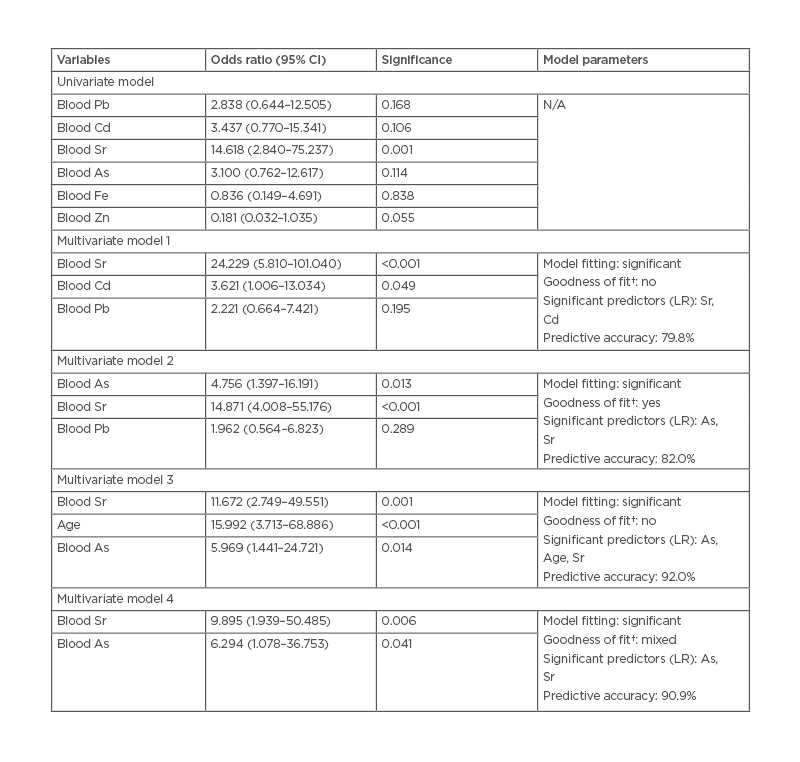
Table 1B: Significant features of trace elements and odds ratio with chronic kidney disease.
*Compares the full model containing all the predictors against a null model.
†Contains deviance and Pearson chi square tests. A mixed result indicates features do not agree on whether the data fits the model well.
Median cut-off levels for each variable: Pb (17.57 µg/L); Cd (1.94 µg/L); Sr (40.63 µg/L); As (4.08 µg/L); Fe (362.9 µg/L); Zn (5.94 µg/L). Multivariate models follow top-ranking features derived in previous analysis. Multivariate model 4: adjusted for age, gender, and systolic blood pressure.
As: arsenic; Cd: cadmium; CI: confidence interval; Fe: iron; LR: likelihood ratio; N/A: not applicable; Pb: lead; Sr: strontium; Zn: zinc.
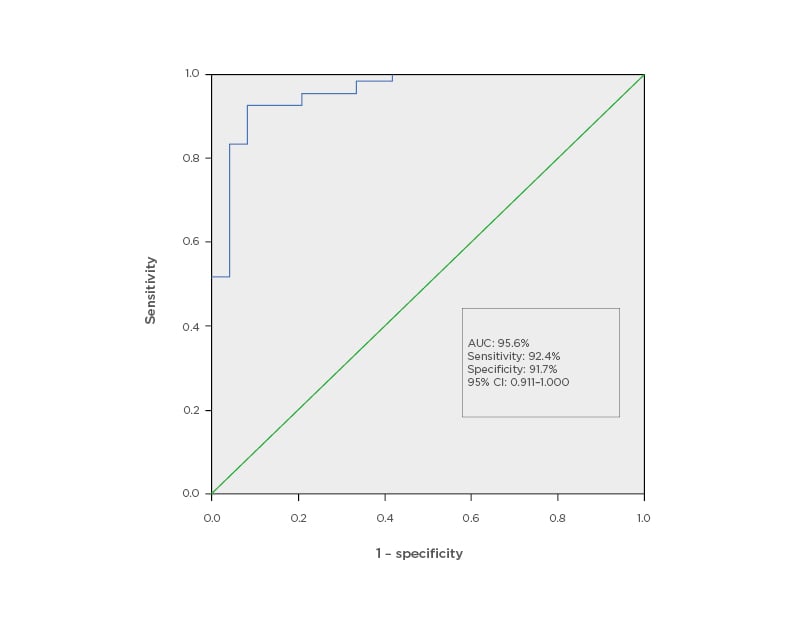
Figure 2: Receiver operator curve for strontium as a potential marker for chronic kidney disease.
AUC: area under the curve; CI: confidence interval.
DISCUSSION
This study found that blood Sr levels increased significantly with a corresponding decline in kidney function. Blood Sr levels rose in patients with CKD-5D even after HD, suggesting a veritably higher exposure risk as compared to subjects without CKD. The strong linear progression with increasing severity of kidney disease and associations with HD treatments strongly suggest that the cumulative trend is associated with increased retention of Sr because of interventional treatment peculiar to patients with ESRD. A similar finding by Schrooten et al.22 reported significantly high Sr levels in a study involving 34 dialysis centres and mainly attributed uptake to be from dialysate fluid or from administration of vitamin D supplements and phosphate binders. If so, patients on HD would be more vulnerable to Sr exposure due to increased renal retention and chronic intake of dietary supplements and medications that contain Sr. In healthy individuals, Sr is preferentially excreted over calcium (Ca) despite being absorbed at lower levels by comparison; however, in CKD, as renal excretion of Sr declines, excretion rates become comparable to that of Ca and competes with Ca for bone absorption.23-25 Under the deficient conditions of Ca, vitamin D, and/or phosphorus and reduced serum protein, Sr absorption increases and can precipitate strontium rickets.26,27 As a strong precedent has been set for its involvement in osteoporosis and fracture risk assessment, the association between Sr and mineral bone disease is an equally relevant cause for further research. What is evidently a direct relationship between Sr and kidney disease is extremely promising as a potential marker.
Pb and Cd also compete with Ca for the binding sites on transport proteins; however, they do not have the equivalent ionic mimicry that Sr has with Ca.28 A series of studies performed by the National Health and Nutrition Examination Survey (NHANES), Centers for Disease Control and Prevention (CDC), showed positive associations between nephrotoxins Cd and Pb and CKD, including Navas-Acien et al.29 and Ferraro et al.30 who demonstrated an inverse relationship between Cd and Pb and CKD, and direct associations of Cd with albuminuria and eGFR. Buser et al.12 confirmed these findings, relating inverse relationships of Pb and Cd to eGFR.12 However, Kim et al.31 found that only exposure of Cd was associated with CKD risk in patients from Korea with diabetes or hypertension, despite registering higher mean blood levels of Cd and Pb as compared to their counterparts from the USA. Differences in sources of exposure and genetic make-up, among other factors, may explain these discrepancies. In some models, eGFR was also inversely related to blood As. When investigating As, the Strong Heart Study29 revealed significantly lower urinary excretion rates of As in patients with CKD, suggesting retention of the trace element was a factor in As. Palaneeswari et al.32 suggest that their results showing elevated As in 50 patients with ESRD may be the cumulative effect of decreased renal excretion, among other reasons.
These trace elements have known nephrotoxic potential and a strong affinity for renal tissue, employing different mechanisms by which they interact and interfere with resident signalling molecules, transport proteins, and organelle function to cause kidney injury.33,34 Like Buser et al.,12 the present study concludes that reverse causality is primarily responsible for the overall increase of non-essential element levels observed in patients with CKD. Simply put: reduced excretion results in increased retention. Other mechanisms may be at play, selectively increasing Sr blood levels in comparison to that of other non-essential elements; however, the inverse relationship with eGFR can be utilised to monitor kidney function.
The reports on comparative trends of essential elements were generally more diverse. In this study, only Fe and Zn showed initial significant associations with CKD. However, after adjustments for age, sex, and BP, these associations were not statistically significant. Consequently, the purported accumulation of Cr and V reported in other studies was not observed in this study. Tonelli et al.16 in a meta-analysis of 128 studies (patients per study ranged from 6 to 456 patients; median: 24) determined that Cu, Cr, and V blood levels were increased in patients on HD, while decreased Se and Zn trends were common. Another review by Jankowska et al.35 contended that decreased Zn and Se and elevated Cu levels are associated with CKD. However, previous studies by Prodanchuk et al.,36 which did not include Fe levels, reported an increase in Cu (p=0.114), Cr (p<0.001), Zn (p<0.001), and V (p<0.001) and a decrease in Se (p<0.05) in 41 patients with ESRD. Dlugaszek et al.37 countered with an investigation of Fe, Zn, Cu, and Cr in serum, erythrocytes, and hair from 31 patients. While elevated levels of Cr (p<0.001) and Fe (p>0.05) were displayed in each measurement, the inverse trend (p>0.05) was apparent in hair (decreased Zn and increased Cu) when compared to serum and erythrocytes. Lokesh et al.,38 conversely, reported decreases in Se (p=0.217) and increases in Cr (p<0.001) in 40 patients with ESRD; Fe, Zn, V, and Cu were not included in this analysis. Raoofi et al.39 claimed significant decreases in both serum Cu and Zn in patients with ESRD, while Balla and Ismail40 concluded HD increased serum Zn and decreased serum Cu, though Zn levels remained deficient in ESRD as compared to controls.39,40
The phenomenon of interrelationships between trace elements was observed in this study. Generally, the authors postulated that antagonistic relationships between and among trace elements were partly responsible for their observations apart from the eGFR. Few studies have evaluated the significant clinical outcomes associated with those trace element findings; however, Tonelli et al.,17 in a prospective longitudinal study, evaluated several clinical outcomes and reported significant associations between risk of mortality and increased hospitalisations with lower concentrations of Se.17
Generally, lower levels of trace elements with protective biological properties such as Fe, Zn, and Se are observed in patients with chronic diseases, a consequence of increased mobilisation to counter oxidising events precipitated by or causing chronic disease.41 As a consequence, diminished levels of essential elements increase the susceptibility for infection, oxidative stress, and proinflammatory processes.35,42,43 The non-linear trends observed indicate a more complex interplay in the pathophysiology of CKD and inadequate recovery mechanisms in more severe disease, as well as antagonistic relationships with non-essential elements.
This study’s findings provide a compelling case to pursue validation and/or classification studies for the association of Sr as a biomarker of CKD.As this was the first trace element profiling study carried out among patients with CKD in Jamaica (and the wider Caribbean region), this study provided unique insight to previously unknown associations, and the collaborative framework established during this study provides an optimistic outlook for follow-up studies. However, the lack of funding presented the greatest challenge and limited the sample size of the study population. This prohibited the involvement of participants from rural parishes bordering the island, particularly to the west. As a result, study findings cannot be applied to the entire CKD population in Jamaica. Furthermore, the cross-sectional design of the study does not allow the case for causation to be made. It also does not adequately explore the potential risk for progression of CKD. While it can provide a baseline for further work, a longitudinal approach to investigate trace element levels in relation to the decline of kidney function would better capture this relationship. In so doing, related adverse health outcomes can be assessed as secondary endpoints. Additionally, parameters that may contribute to the trace element constitution of subjects should be accounted for in future studies. These include lifestyle habits, occupational exposure, and drug exposure, amalgam or prosthetic use.
Data related to recreational/prescription drug and oral supplement intake and other therapeutic options used by patients with CKD should also be accounted for, particularly those highlighted in studies as potential sources of exposure. Exposure assessment should include phosphate binders, vitamin D, and other commonly consumed dietary supplements and a comprehensive trace element profile of dialysate fluid used during HD therapy. The prevalence of CKD and seasonal and dietary factors should also be evaluated for their potential role in observed trace element trends in the general population. It may be that trace element profiles for CKD vary based on geographical locations. As such, national biomonitoring surveys should be performed to establish reference intervals to permit the identification of abnormal trace element findings and subsequent classification as excess or deficient levels accordingly.
CONCLUSION
The association between blood Sr and CKD has not been a finding widely discussed in published work. Certainly, in the Caribbean it is a novel concept that could expand the use of the trace element profiles in the biomarker analysis of CKD, particularly if these associations are independent of external factors unrelated to the disease pathophysiology. Researchers in the region should be encouraged to explore further trace element relationships, and perform risk analysis of high-risk groups for chronic disease and potential sources of exposure to non-essential and nephrotoxic trace elements.