BACKGROUND AND AIMS
Endoleak is the drawback of endovascular aneurysm repair (EVAR), and is defined as the continued blood flow inside the remnant abdominal aortic aneurysm (AAA) sac despite stent-graft deployment.1 CT angiography is the gold standard imaging modality for endoleak detection after EVAR.2 Among five types described, Type II endoleak (T2EL) is by far the most common but its clinical effects after diagnosis remain controversial. Most T2ELs usually follow a benign course and resolve spontaneously within 6 months.3 On the contrary, persistent T2ELs require lifelong imaging surveillance to assess their impact on the AAA sac size. To the best of the authors’ knowledge, the exploitation of data derived from dual-energy CT imaging for predicting the evolution of T2EL after EVAR has not been previously investigated. The aim of this study was to investigate the value of dual-energy CT imaging as an adjunct to discriminate aggressive from benign T2EL after EVAR.
MATERIALS AND METHODS
Study participants were consecutive patients referred for CT at 1 month after EVAR. CT imaging acquisition included a dual-energy CT angiography (DECTA) and a delayed single-energy CT (SECT) imaging. Patients diagnosed with T2EL were re-examined at 6 months post-EVAR to assess the aneurysm sac growth (ASG) through ASG=D6-D1, where D1 and D6 represent the maximum AAA sac diameter at 1 month and 6 months CT imaging, respectively. Upon ASG recorded, patients were categorised as having benign (Group A) or suspicious for aggressive (Group B) T2EL.
DECTA image data (Figure 1) were employed to calculate five parameters: the normalised effective atomic number (NZeff), through Figure 2A; the normalised iodine concentration (NIC), through Figure 2B; the slope (S) of Hounsfield unit (HU) HUendoleak/HUaorta against monochromatic energy, through Figure 2C; the dual-energy index (DEI), through Figure 2D; and an improvised endoleak index (EI), through Figure 2E for each T2EL. Statistical analysis was employed to compare all above parameters regarding their ability to differentiate aggressive from benign T2EL. The sum of three SECT imaging acquisitions commonly involved in follow-up CT examinations of EVAR patients was compared regarding patient radiation burden to a CT examination comprised by a DECTA and a delayed SECT.
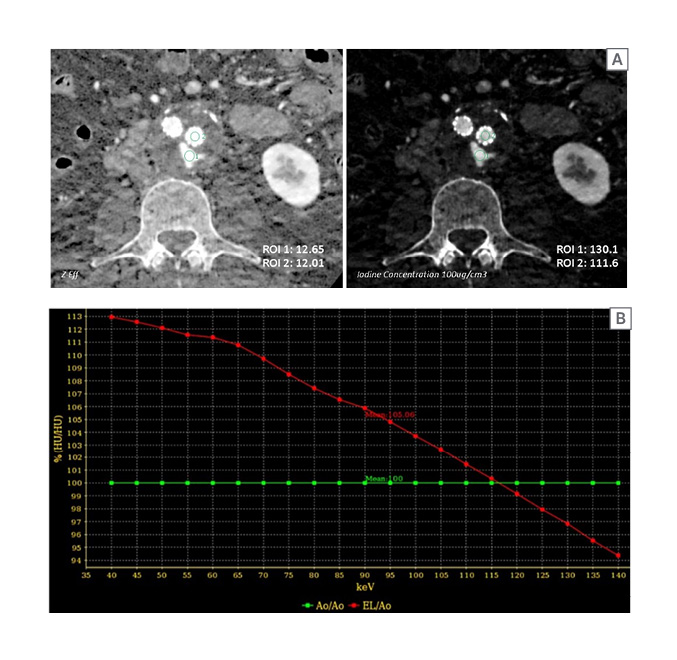
Figure 1: A) Zeff and IC axial images are illustrated. B) HUendoleak/HUaorta against monochromatic energy is illustrated.
A) ROIs were placed on endoleak (ROI 1) and within aorta (ROI 2) to obtain the NIC and NZeff for T2EL. B) S, DEI, and an improvised parameter, EI, were calculated.
Ao: aorta; DEI: dual energy index; EI: endoleak index; EL: endoleak; HU: Hounsfield unit; IC: iodine concentration; NIC: normalised iodine concentration; NZeff: normalised effective atomic number; ROI: region of interest; S: slope; T2EL: Type II endoleak; Zeff: effective atomic number.
RESULTS
Among 40 patients examined at 1 month after EVAR, 14 patients (35%) were diagnosed with T2EL. Among the 14 patients diagnosed with T2EL, nine patients were assigned to Group A, and five patients were assigned to Group B. NZeff and EI were found to be significantly lower in Group A than in Group B (p<0.05). There were no significant differences in NIC, DEI, and S values between Groups A and B (p>0.05). NZeff was found to have the highest power to discriminate aggressive T2EL with an area under the curve of 86.7%, showing 100% specificity and 60% sensitivity. Similarly, EI showed an area under the curve of 84.4%, specificity of 100%, and sensitivity of 60%. The mean effective dose from DECTA and SECT scans was 27.8% lower compared with the corresponding cumulative dose from the commonly employed imaging scenario that includes three SECT acquisitions (27.06 versus 37.47 mSv, respectively).
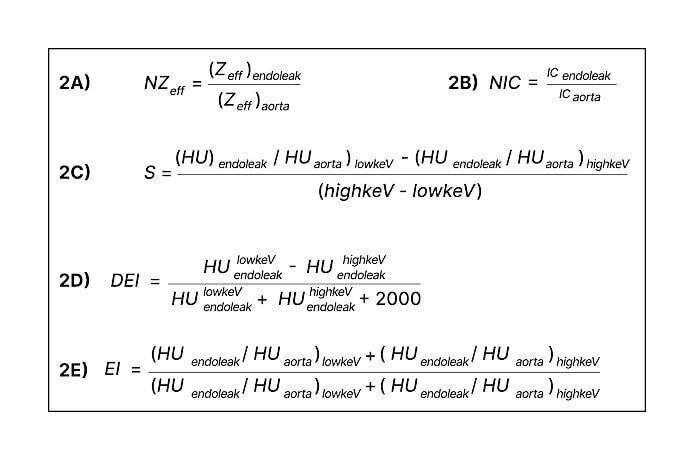
Figure 2: Parameters calculated with DECTA imaging data.
DEI: dual-energy index; EI: endoleak index; HU: Hounsfield unit; IC: iodine concentration; NIC: normalised iodine concentration; NZeff: normalised effective atomic number; S: slope; Zeff: effective atomic number.
CONCLUSION
In conclusion, the use of DECT imaging at 1 month after EVAR may provide quantitative indices able to discriminate aggressive from benign T2ELs after EVAR, and could therefore provide decision support tools to assist in patient management.