Abstract
Background: COVID-19 is a highly infectious disease that necessitates simple and rapid methods for recognising severe patients.
Aims: To correlate between chest lesions in CT, neutrophil-lymphocyte ratio (NLR), and platelets-lymphocytes ratio in patients with COVID-19, and to detect their cut-off values as an early warning of severe COVID-19 in Egyptian patients.
Subjects and Methods: A cross-sectional study included 100 adult patients with COVID-19 attending Ahmed Maher Teaching Hospital, Cairo, Egypt. Clinical, laboratory, and radiological assessments were done. They were classified according to their CT grades into three groups: seven patients with a normal chest CT, 45 non-severe cases, and 48 severe cases.
Results: Dyspnoea was the most common symptom among the severe cases (79.2%) and fever among non-severe cases (71.1%), while cough (85.7%) was the most common among cases with a normal CT. The age, NLR, C-reactive protein (CRP), and D-dimer of severe cases were significantly the highest, while the absolute lymphocytes were significantly the lowest. Highly significant positive correlations were found between CT grades with D-dimer, NLR, and CRP; significant positive correlation was found with age; and significant negative correlation with CT. Using receiver operating characteristic analysis, areas under the curve of D-dimer, NLR, age, CRP, ferritin, and platelet-lymphocyte ratio were 0.760, 0.698, 0.640, 0.627, 0.614, and 0.595, respectively. The optimal cut-off value of NLR was 2.50 with 0.74 specificity, 0.61 sensitivity, and 67.5 accuracy.
Conclusion: NLR is a reliable and easy-to-use predictor of COVID-19 severity. NLR (>2.5) should prompt prescription of a chest CT as it could reveal essential lesions that influence further management.
Key Points
1. COVID-19 is an abruptly progressing and sometimes lethal contagious disease, which necessitates simple and rapid methods for recognising patients with severe responses.
2. Circulating biomarkers are potentially useful in the diagnosis and prognosis of patients with
COVID-19. The neutrophil-lymphocyte ratio is an easy-to-use and reliable predictor in the effective screening, early isolation, and management of patients infected with COVID-19.
3. A neutrophil-lymphocyte ratio more than 2.5 should persuade clinicians to define chest CT, as it could manifest primary lesions that could impact further management.
INTRODUCTION
COVID-19 is an abruptly progressing and sometimes lethal contagious disease. It is caused by severe acute respiratory syndrome coronavirus 2 (SARS-CoV-2), which was first reported in Wuhan, China, at the end of 2019. The World Health Organization (WHO) announced it as a pandemic in March 2020.1
Circulating biomarkers are potentially helpful in the diagnosis and prognosis of patients with COVID-19.2 Disturbance of erythrocyte sedimentation rate and C-reactive protein (CRP) were connected to increased severity of COVID-19 infection.3 There are also some eminent changes in haematological parameters such as leucopenia, lymphopenia, elevated lactate dehydrogenase, D-dimers, and ferritin, that may be specific for SARS-CoV-2 infection.4
The platelet-lymphocyte ratio (PLR) and neutrophil-lymphocyte ratio (NLR) are considered as indices of systematic inflammatory reaction.5 They have been vastly evaluated in many other conditions such as malignancies, cardiovascular diseases, and intra-cerebral haemorrhage. Greater values were connected to intense forms of diseases with very bad prognosis.6 As they are one of the routine laboratory tests, they are non-costly, available, and easily measurable.7 NLR can be utilised as a prompt warning indicator of severe COVID-19.8 However, most previous studies were reported from China and, to a lesser extent, some countries in Europe, without concern for PLR.
Imaging studies play a significant function in the diagnosis and follow-up of patients with COVID-19. A CT of the chest is used as the main imaging tool in doubtful cases and is a valuable tool for supervising the changes and reflecting the severity during treatment.9 Abnormal findings in CT can be present even in asymptomatic patients; therefore, combining imaging assessment with clinical and laboratory results could favour precocious diagnosis of COVID-19.10
The severity of lung involvement on high resolution CT correlates positively with laboratory findings, and this provides an insight into the appropriate interval of chest CT to reduce radiation exposure and support proper management of patients with COVID-19.11
The purpose of this study was to correlate between PLR and NLR the degree of severity of CT lesions in patients suffering from COVID-19, and to detect cut-off values for these ratios to be used as an early warning indicator for determining the severity of COVID-19 in Egyptian patients.
PATIENTS AND METHODS
Patients
This was a cross-sectional study that included 100 adult patients who attended Ahmed Maher Teaching Hospital, Cairo, Egypt, during the period from March 2020 to April 2021, with symptoms of the clinical characteristics of COVID-19 and confirmed by real-time PCR (RT-PCR). The enrolled patients included 44 males and 56 females with a range of age from 19–88 years.
The protocol was approved by the ethical committee of the General Organization for Teaching Hospitals and Institutes (GOTHI; institutional review board number: HAM00152). Adult patients aged ≥18 years old, having clinical manifestations that included fever and pulmonary symptoms (such as cough, shortness of breath, and chest pain) and who tested positive for SARS-CoV-2 using RT-PCR from respiratory samples (nasal/oropharyngeal swab) were enrolled in the study. Patients with suspected bacterial pneumonia (confirmed by sputum culture), who had an incomplete chest CT examination, were excluded from the study.
Methods
After taking a valid informed consent, clinical, laboratory, and radiological assessments were obtained.
Clinical assessment
A detailed history was obtained and, following a thorough clinical examination, the need for intensive care unit (ICU) admission was recorded. The patients were categorised during an emergency room assessment into two groups according to their O2 saturation. The normal range of O2 saturation at rest was defined as 94–98% in patients without chronic lung disease, and between 88–92% in those with chronic lung disease associated with hypoxia.12 A pulse oximeter reading of 92% or lower was one defining feature of severe condition in acute COVID-19, while a reading of 93–94% indicated moderate severity.13
Laboratory assessments
Venous blood samples were sent to assess the following: complete blood count (haemoglobin [Hb] norm: 11.5–15.5 mg/dL; red blood cell [RBC] norm: 4–5.2 x10¹²/L; haematocrit norm: 36–45%; absolute lymphocyte norm: 1,000–4,800 /µL; platelets norm: 150,000–450,000 /µL): CRP norm: <5 mg/L; ferritin norm: 10–120 ng/mL; and D-dimer norm: <0.5 µg/mL). NLR and PLR were calculated with the reference values of significance; NLR>2.8 and PLR>180.2 NLR was calculated using the simple formula: absolute number of neutrophils/absolute number of lymphocytes; and PLR was calculated using the simple formula: absolute number of platelets/ absolute number of lymphocytes.
Radiological assessment
The severity of COVID-19 was categorised on the basis of a chest CT. High resolution CT of the chest was performed using GE64 row 128-slice CT scanning equipment (GE HANGWEI Medical System, Beijing, China).
In all cases, the CT severity scoring system suggested by Pan et al.14 was calculated for each of the five lobes regarding the extent of pathologic involvement, as follows: 0: no involvement (normal); 1: <5%, mild involvement; 2: 5–25%, mild-to-moderate involvement; 3: 26–50%: moderate involvement; 4: 51–75%, moderate-to-severe involvement; and 5: >75%, severe involvement.
STATISTICAL ANALYSIS
The patients’ data were analysed utilising Statistical Package for Social Sciences (SPSS, Windows Version 18, SPSS Inc., Chicago, Illinois, USA). Normality of data was tested using the Kolmogorov–Smirnov test. Most of the variables such as O2 on admission, NLR, PLR, CRP, ferritin, and D-dimer, were not normally distributed. Therefore, the non-parametric tests were used. P<0.05 was considered statistically significant.
Continuous variables were presented as means and standard deviations, while categorical variables were outlined as numbers and percentages in each category. The Kruskal–Wallis test was applied to compare between more than two groups, while categorical variables were compared using chi-square test. Receiver operating characteristic curve (ROC) was used to assess the optimal cut-off value of the continuous NLR, its sensitivity, specificity, accuracy, and positive and negative predictive values (PPV and NPV). True-positive cases were those with high NLR and high CT chest grades and true-negative cases were those with low NLR and low chest CT grades, while false-positive cases were those with high NLR and low chest CT grades and false-negative cases were those with low NLR and high chest CT grades.
Sensitivity was measured using the equation: true-positives/(true-positives plus false-negatives); while specificity was measured as true negatives/(true-negatives plus false-positives). PPV was defined as the percentage of cases with high CT chest grades that had high PLR. NPV was defined as the percentage of cases with low CT chest grades that had low PLR. Maximal accuracy and PPV/NPV closest to 1 were used for determining cut-off level.
RESULTS
The clinical characteristics of the participating subjects are shown in (Table 1). Insignificant differences were observed in terms of sex, presence of associated chronic diseases, and clinical symptoms. Most of them exhibited comorbidities such as diabetes (42%), followed by hypertension (30%), while the minority was suffering from ischaemic heart disease (8%), pulmonary diseases (7%), chronic kidney disease (6%), and heart failure (1%). Nobody was suffering from chronic liver disease.
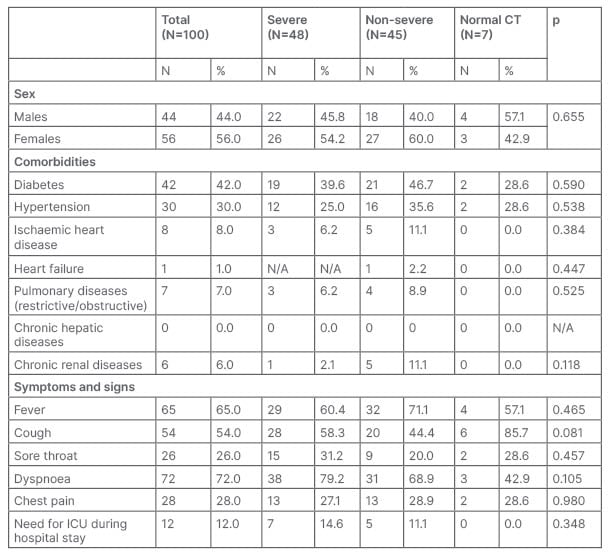
Table 1: Clinical characteristics of the study sample according to CT chest groups (chi square test).
ICU: intensive care unit; N/A: not applicable.
Depending on their chest CT, patients were classified into three groups: seven patients (four males and three females) with a normal chest CT; 45 (18 males and 27 females) were non-severe (score 1–3); and 48 (22 males and 26 females) were severe cases (score 4–5). The most common symptoms were dyspnoea (72%), fever (65%), and cough (54%), followed by chest pain (28%) and sore throat (26%). Only 12% were admitted to ICU during their hospital stay. Dyspnoea was the most common symptom among severe cases (79.2%), fever was the most common among non-severe cases (71.1%), while cough was most common among patients with a normal CT (85.7%).
Table 2 reveals highly significant differences between the the groups of cases for NLR (p=0.002), CRP (p=0.005), and D-dimer (p=0.004); and significant differences for age (p=0.039) and absolute lymphocytes (p=0.030). Age for the severe cases ranged from 19.00–88.00 years old, with a mean age of 57.35+15.71 years old. Mean age for non-severe cases was 54.69+11.87 years old, ranging from 23.00–77.00 years old, while the mean age for patients with a normal chest CT was 42.57+12.66 years.
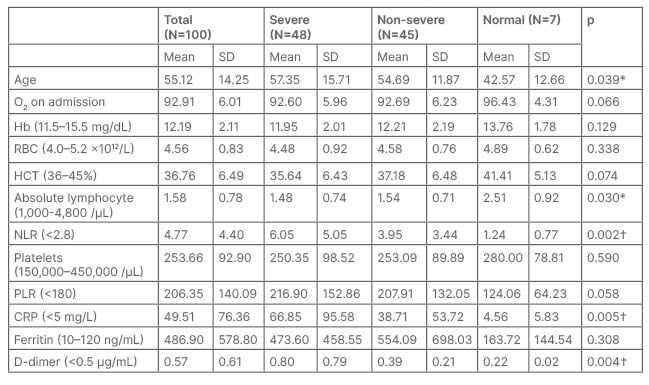
Table 2 : Baseline characteristics of the laboratory investigations of the study sample according to CT chest groups (Kruskal–Wallis Test).
The test result variable(s): age, platelet/lymphocyte ratio (>180), C-Reactive protein (<5 mg/L), D-dimer (<0.5 µg/mL) have at least one tie between positive and negative actual state groups. Statistics may be biased.
*p>0.05: significant difference
†p>0.01: highly significant difference
CRP: C-reactive protein; Hb: haemoglobin; HCT: haematocrit; NLR: neutrophil-lymphocyte ratio; PLR: platelets-lymphocyte ratio; RBC: red blood cell.
The age, NLR, CRP, and D-dimer of severe patients were significantly the highest, while the absolute lymphocytes were significantly lower than those of non-severe cases and cases with normal chest CT. Among the severe cases, PLR was insignificantly the highest, while O2 on admission, Hb, RBC count, haematocrit, and platelets were insignificantly lower than the other two groups.
Using the ROC analysis (Figure 1), areas under the curve (AUC) of D-dimer, NLR, age, CRP, ferritin, and PLR were 0.760, 0.698, 0.640, 0.627, 0.614, and 0.595, respectively. They are useful prospective diagnostic biomarkers for subsequent studies because its AUC was more than 0.5000.
The most appropriate cut-off value for NLR was 2.50, with 0.74 specificity, 0.61 sensitivity, 0.70 PPV, 0.66 NPV, 1.07 PPV/NPV, and 67.50 accuracy (Table 3).
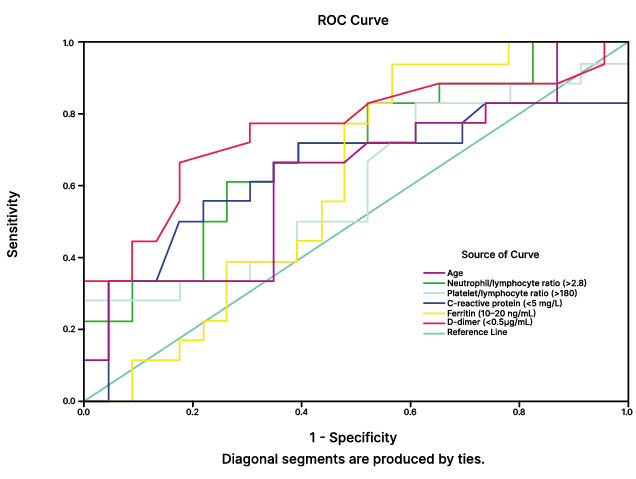
Figure 1: Using receiver operating characteristic curve analysis, areas under the curve of D-dimer, neutrophil-lymphocyte ratio, age, C-reactive protein, ferritin and platelets-lymphocyte.
ROC: receiver operating characteristic.
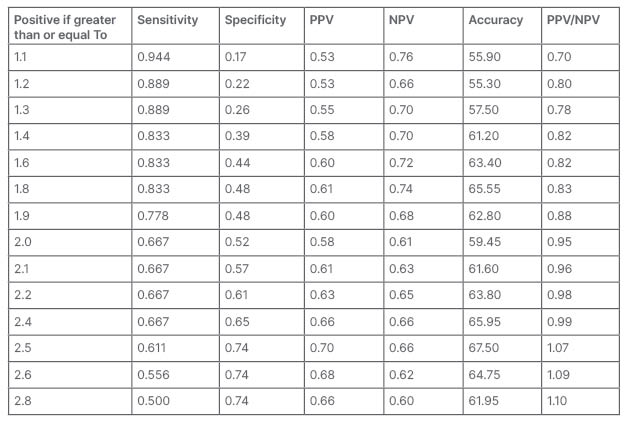
Table 3: Neutrophil-lymphocyte ratio cut-off levels determining the COVID-19 CT chest progression using receiver operating characteristic analysis.
NPV: negative predictive values; PPV: positive predictive values.
DISCUSSION
Being a highly infectious disease, COVID-19 depletes effective health care facilities. Circulating inflammatory biomarkers used to evaluate immune status are helpful in the diagnosis of COVID-19. Inflammation has a remarkable role in the progress of viral pneumonia, and severity of the inflammation relates to the adaptive immune system.2 Rapid, simple, and available risk stratification methods are obligatory to distinguish with severe disease.15
There are some changes in blood such as leucopenia, lymphopenia, and disturbance of CRP and erythrocyte sedimentation rate, which are correlated to severity of COVID-19 infection. Some are discriminatory for SARS-CoV-2 infection, including D-dimer, lactate dehydrogenase, and ferritin.4
This study encompasses easily available investigations such as a complete blood picture to find the effect of COVID-19 in the respiratory system and its probable progress by comparing with the same radiological severity, thus helping to determine early measures of treatment. Enrolled patients were classified according to CT into three groups; cases with normal CT chest, non-severe cases (mild, mild-to-moderate, and moderate), and severe cases (moderat-to-severe and severe).
In this study, 100 adult patients (44 males and 56 females) clinically suspected to have COVID-19 were assured by positive result of RT-PCR. Male to female ratio was 22:26 in severe cases, 18:27 in non-severe cases, and 4:3 in cases with normal CT, with insignificant differences observed in terms of sex.
Yang et al.5 in China found that in a total of 93 patients, the male to female ratio was 56:37; with 18:6 in severe and 38:31 in non-severe cases. Furthermore, Fu et al.16 in Suzhou, China, found that in a total of 75 patients, the male to female ratio was 35:24 in non-severe cases and 10:6 in severe cases. Similar to the authors’ findings, both have found no statistical difference as well.
In this study, there was a significant difference for age (p=0.039). Mean age for severe cases was 57.35+15.71, 54.69+11.87 years for non-severe cases, and 42.57±12.66 years for cases with a normal chest CT. Similarly, Yang et al.5 found a significant difference for age. They determined the mean age as 58 years, with the maximum as 83 years. The mean age of non-severe patients was 42 years. The age of severe cases was significantly higher than non-severe cases. However, Fu et al.16 found an insignificant difference for age, where mean age among severe cases was 51.8±12.8 years and 45.1±14.0 years for non-severe cases.
In this study, insignificant differences were observed in terms of clinical symptoms. The most common symptoms were dyspnoea (72%), fever (65%), cough (54%), chest pain (28%), and sore throat (26%). Dyspnoea was the most common symptoms among the severe cases (79.2%), fever was the most common among non-severe cases (71.1%), while cough was most common (85.7%) among the cases with normal CT. In accordance with the results of this study, Yang et al.5 detected fever (83.8%) and cough (67.7%) as the initial and most common symptoms. Furthermore, Fu et al.16 found the most common symptoms to be fever (62; 86.7%), cough (54; 72%) and sore throat (12; 16%).
This study showed that most of the patients exhibited comorbidities such as diabetes (42%), hypertension (30%), ischaemic heart disease (8%), pulmonary disease (7%), chronic kidney disease (6%), and heart failure (1%).
Liu et al.17 in China assumed that the most common comorbidity in their study was hypertension (19.0%), followed by coronary heart disease (9.5%). Yang et al.5 found that severe individuals were associated with hypertension (66.8%), diabetes (54.2%), heart failure (37.5%), and renal failure (33.3%). In agreement with the results of this study, all these studies agreed that diabetes and hypertension are among the most common comorbidities reported in severe cases.
According to National Institutes of Health (NIH) guidelines, published in 2021,18 COVID-19 has been categorised clinically into asymptomatic, mild, moderate, severe, and critical, taking into consideration the peripheral O2 saturation and CT severity. In agreement, the authors’ study postulates that, among the severe cases, O2 on admission was insignificantly lower than the other two groups.
Shi et al.10 in Wuhan, China, postulated that chest CTs in COVID-19 manifest as bilateral, ground-glass opacities with ill-defined margins located sub-pleuraly. CT lesions can be present even in asymptomatic patients, but can rapidly progress into a diffuse ground-glass opacity or consolidation pattern within 1–3 weeks. Kumar et al.19 in India suggested that patients with comorbidities have more pulmonary involvement than patients with no non-comorbidities, which indicates the rapid progression of pulmonary damage in groups with comorbidities. Depending on the CT chest examination in the authors’ study, patients were classified into three groups: seven patients (3 males and 4 females) with normal chest CT, 45 patients (18 males and 27 females) with non-severe cases (mild, mild-to-moderate, and moderate), and 48 patients (22 males and 26 females) with severe (moderate-to-severe and severe) cases.
It has been noticed that in severe cases, the absolute values of lymphocytes decreases rapidly while the white blood cell count increases gradually, leading to deflection between the absolute value of neutrophils and lymphocytes, which gave the idea that NLR may be correlated with the poor prognosis of COVID-19. NLR is also associated with bad prognosis in other diseases such as pancreatic cancer and sepsis.20
Our study revealed highly significant differences between the three groups of cases in NLR (p=0.002), CRP (p=0.005) and D-dimer (p=0.004), and significant differences in absolute lymphocytes (p=0.03). NLR, CRP, and D-dimer of patients with severe disease were significantly higher. Among the severe cases, PLR was insignificantly the highest, while Hb, RBCs, haematocrit, and platelets were insignificantly the lowest. Spearman’s correlations between CT grades and laboratory investigations revealed highly significant positive correlations with D-dimer, NLR and CRP.
These results were coincident with those of Yang et al.,5 who proved that elevated NLR was a distinct biomarker of prognosis of COVID-19. These findings were proportionate with other studies on the relation between NLR and prognosis of other infectious diseases.21
In this study, ROC analysis using AUC for D-dimer, NLR, CRP, ferritin, and PLR were 0.760, 0.698, 0.640, 0.627, 0.614, and 0.595, respectively. They could be used as prospective diagnostic biomarkers because their AUC are more than 0.500.
Sarkar et al.22 in India postulated that prognostic value of NLR can be used for early recognition of progressing cases. NLR ≥5 identifies patients likely to develop severe COVID-19, while NLR ≥6 identifies patients with high risk of mortality. Man et al.2 in Romania also found that both NLR and PLR correlate with chest CT grades. When the NLR value is below 5.04 and CT score is less than 3, the probability of CT changes is 94%; meanwhile if the NLR is higher than 5.04, the probability of CT changes is only 50%. Additionally, Yang et al.5 postulated that a threshold at 3.3 for NLR has showed a high possibility of deterioration from mild to severe, with high sensitivity and specificity, and Liu et al.17 have demonstrated that subjects with elevated NLRs (≥4.87) were as much as 8.5 times (95% confidence: 1.962–36.471) more prone to deteriorate than those with a low NLR (<4.87).
In accordance with these results, the authors reported the optimal cut-off value for NLR as 2.50 with specificity of 0.74, sensitivity of 0.61, PPV of 0.70, NPV of 0.66, PPV/NPV of 1.07, and accuracy of 67.5. Therefore, NLR is recommended as a simple tool to estimate the severity of COVID-19 and to assess the prognosis, but this is not applicable for PLR. Fu et al.16 have also found that the blood indices had more AUC than inflammatory markers (NLR: 0.88; D-dimer: 0.74; fibrinogen: 0.74; and lymphocyte: 0.72; versus CRP: 0.72; and procalcitonin: 0.67).
In the authors’ study, only 12% of patients were admitted to ICU during their hospital stay, while among 351 patients who were enrolled by Hashem et al.15 in Egypt, 145 (41.3%) were admitted to ICU. They suggested the most appropriate cut-off point for NLR to predict severe COVID-19 with ICU admission as more than eight, with 60.7% sensitivity and 85.9% specificity. They also reported that the value for PLR of more than 192 has 74.5% sensitivity and of 60.2% specificity. Their high cut-off point may be due to the fact that all patients included were severe cases admitted to ICU.
A major limitation of this study is the lack of a control group.
CONCLUSION
The NLR is an easy-to-use and reliable predictor in the effective screening, early isolation, and early management of patients with COVID-19, but PLR is not reliable. A value of 2.5 for NLR seems to be suggestive for COVID-19 deterioration. NLR of more than >2.5 should persuade clinicians to prescribe a chest CT as it could manifest primary lesions that would impact further management.