
Abstract
Background: A fine balance exists between the early treatment of a potentially lethal prostate disease and possible complications from the early treatment of a potentially indolent disease. Prostate-specific antigen (PSA) is an indicator of disease progression and is used in the clinical staging of prostate cancer (PCa). Given the arsenal of staging methods available, some intrusive, some not, is there a future for biochemical staging? As the presence and stage of disease are influenced by multiple factors, it is conceivable that an effective biomarker for determining pathology and stage could require a convolution of more than one biochemical entity. In this study, the authors introduce a malignancy index capable of staging PCa and discriminating pathology from non–pathology, in three unmatched sample types.
Methods: Total protein measurement was by means of the Pierce Bicinchoninic acid protein assay. The total PSA concentrations were measured using a microparticle enzyme immune assay, and ELISAs confirmed the urokinase plasminogen activator and plasminogen activator inhibitor–1 concentrations. The three markers (PSA, urokinase plasminogen activator, and plasminogen activator inhibitor-1 as well as patient age) were used in the formulation of a malignancy index (the degree of a person’s vulnerability to disease).
Results: The authors examined the robustness of their malignancy index in transurethral resection and biopsy tissue and plasma samples and proved that it discriminated PCa from non–PCa and was able to predict tumour stage.
Conclusions: The malignancy index in this preliminary research increases with disease stage (T1 through T4) and deserves some attention as a credible marker.
Key Points
1. Prostate cancer staging is important for prognosis of the disease after determining its severity, and for determining the treatment course, however, staging continues to present challenges as not every patient will present with abnormal results in all tests.
2. In the present study transurethral and biopsy tissue and plasma samples were used in order to test the robustness of a malignancy index that discriminates prostate cancer from non–prostate cancer and its ability to predict tumour stage.
3. Despite a number of limitations, this study demonstrated that the malignancy index deserves some attention as a credible marker as it increases with disease stage (T1 through T4) across three independent prostate sample types
INTRODUCTION
Prostate cancer (PCa) is the second most frequent cancer diagnosed in males and the fifth leading cause of death worldwide.1 In the USA, the PCa death rate has dropped by approximately 4% each year from the mid-1990s to 2013, as a result of prostate-specific antigen (PSA) testing and advances in treatment, but this is no longer so.2 PCa screening using PSA remains controversial due to the risk of over-diagnosis and over-treatment since many of the cancers diagnosed would remain asymptomatic, demonstrating that a protein whose expression is limited to specific tissues can be difficult to interpret at the clinical level.3 Its specificity is limited by a high frequency of falsely raised values, and approximately two-thirds of all PSA values greater than 4 ng/mL in males older than 50 years are due to benign prostatic hyperplasia (BPH).4
A fine balance exists between the advantages of early treatment of a potentially lethal disease and possible complications from the early treatment of a potentially indolent disease. Apart from diagnosing PCa, the PSA assay is useful in tracking the progression of the disease and its response to treatment.5,6
Two studies found that 55% of males aged 46–84 years and diagnosed histologically with BPH had PSA values greater than 4 ng/mL.7,8 It also emerged from their studies that 33% of patients with PCa showed low levels of PSA. These individuals would constitute a false-negative sub-group and may not receive treatment at all.
Limitations associated with PSA testing have led to a search for alternative biomarkers. Urokinase plasminogen activator (uPA) and its inhibitor, plasminogen activator inhibitor-1 (PAI-1), have been implicated in tumour aggressiveness and metastatic potential in breast cancer.9-11 Clearly defined cut-off values of >3 ng/mg protein and >14 ng/mg protein for uPA and PAI-1, respectively, are linked with a poor outcome in node-negative breast cancer.12,13 In fact, overexpression of PAI-1 is associated with a poor outcome in several cancers such as colon, thyroid, cervix, lung, and mouth, amongst others.14-18 The clinical value of uPA and PAI-1 determination is, at present, still limited to breast cancer and no Level 1 evidence of benefit has been clinically demonstrated for these two markers in other malignancies. To date, no definitive role of the involvement of uPA and PAI-1 in prostate cancer has emerged.
In view of the association between breast cancer and PCa, and the similarity of their invasion process, the concentration of uPA and its inhibitor was determined in transurethral resection tissue (TURP), needle biopsies, and blood samples using ELISA methodology. The intention here being the search for a non-invasive prostate marker. A recent prostate needle biopsy study found that a PAI-1 value of ≥4.5 ng/mg protein in males of 60 years and older was moderately predictive for PCa, with a sensitivity of 63%.19
The uPA/PAI-1 ratio in surgical resections of prostate tissue was seen to discriminate prostate pathology from non-pathology but showed a dependence upon patient age.7 This separation was not apparent for needle biopsy tissue, where PAI-1 was seen to act as a sole PCa biomarker. Males 60 years of age and older with PAI-1 values above 3 ng/mg protein were more likely to have PCa.8 This result did not hold entirely in a subsequent study, which led to the formulation of a malignancy index. On average, the malignancy index in TURP tissue, biopsy tissue, and plasma from patients with PCa was approximately 39-, 19-, and nine-fold higher, respectively, than that obtained from individuals with BPH and healthy volunteers.20
PCa staging can be either clinical or pathological. The former is based on the results of tests to determine the extent of the cancer and guide the treatment plan. The latter is based on what information is discovered after surgery and is likely the more accurate.21
Urological cancers are assessed universally by the tumour-node-metastasis system, which is considered the ‘gold standard’.22
To adequately assess the patient’s prognosis and plan the management, PCa staging must make use of the many clinicopathological parameters at its disposal.23 These novel prognostic biomarkers aid in avoiding unnecessary imaging studies and invasive interventions.
It is well known that clinical staging suffers from the subjectivity of rectal examinations and variable imaging modalities.24,25 The traditional PSA, and imaging and Gleason scores, may not accurately predict the patient’s prognosis.26 This has led to the search for biomarkers and PCa genetic alterations that may aid decision-making.27 Emerging data has linked several germline DNA mutations to PCa but their value in the setting of PCa is unclear.28
In this study, using transurethral and biopsy tissue and plasma samples, the authors examine the robustness of a malignancy index that not only discriminates PCa from non–PCa but is able to predict tumour stage.
METHODS
Patient Eligibility Criteria
All consenting males presenting with a urologic problem (a raised PSA and enlarged prostate on digital rectal examination [DRE]) were eligible for the study. All consenting healthy male blood donors were also eligible and formed the control group.
Patients, Donors, and Sample Collection
The project was approved (reference: N09/11/330) by the Ethics Committee of the Faculty of Medicine and Health Sciences at the University of Stellenbosch, South Africa, and conducted in accordance with the Helsinki Declaration of 2013. Participants (who were Black, White, or of mixed ancestry) aged between 19 years and 86 years were included in the study. Patients and donors were recruited, and samples used in the study were collected over a period of 2 years (2014–2016).
Citrated blood samples were obtained from patients after signed consent and according to ethics guidelines. Care was taken when drawing the blood to avoid platelet activation and the release of platelet PAI-1. The samples were double-centrifuged at 1,500xG for 10 min, and platelet-free aliquots of plasma frozen at -80 °C. Haemolysed and lipaemic plasma samples were excluded. Patients and volunteers were recruited from the Tygerberg Academic Hospital, Cape Town, South Africa, and the Western Province Blood Transfusion Services, Cape Town, South Africa. Control samples and blood from patients diagnosed with PCa, based on PSA, DRE, Gleason score, and histopathology, were taken, as described elsewhere.7,20
Prostate needle biopsies and TURP were obtained from patients, after signed consent and according to ethics guidelines. Patients were recruited from the Gatesville Medical Centre, Cape Town, South Africa, and the Tygerberg Academic Hospital, Cape Town, South Africa. Patients were screened by PSA and DRE. An abnormal PSA and/or DRE finding resulted in the patient having an eight-core transrectal prostate biopsy. A histology positive score was added to the PSA and DRE scores to obtain a 10-point final score. For example, patients with a negative DRE, a PSA value of 4 ng/mL, and one positive core received a rating of 1, indicating a low probability of PCa and a high probability of BPH. An unmistakably abnormal DRE with a PSA value of 100 ng/mL and one or more positive cores received a rating of 10, indicating a high probability of PCa and a low probability of BPH. The scoring system was not validated and, therefore, only patients who scored 8 or more in the PCa category were included. To reduce errors, the clinical data and patients’ scores were reviewed by a second urologist. The scoring system was devised to obtain a high level of certainty of PCa identification, with a low probability of missing the same.
Measurement of Total Protein, Urokinase Plasminogen Activator, and Plasminogen Activator Inihibitor-1 Content
Aliquots of the protein extracted from the test samples were assayed by means of the Pierce Bicinchoninic acid protein assay (Thermo Fisher Scientific, Rockford, Illinois, USA). In brief, the total protein concentration is indicated by a colour change of the test solution from green to purple in proportion to protein concentration, which is then measured using a colorimetric technique. Confirmation of the uPA and PAI-1 content was by the Imubind® ELISA (Sekisui Diagnostics, Stamford, Connecticut, USA), as described elsewhere.29 The total protein was expressed as mg/mL, while the uPA and PAI-1 content was expressed in ng/mg total protein. To test the ability of the pair of markers to predict disease state, uPA and PAI-1 concentrations were calculated for each sample, and the data for the PCa, BPH, and control groups compared.
Measurement of Total Prostate-Specific Antigen
The AxSYM® (Abbott Laboratories, Illinois, USA) total PSA in patient and control sera was measured using a microparticle enzyme immune assay and expressed as ng/mL. Since it was not required for healthy volunteers (controls) to have a PSA test, age-matched PSA levels (mean: 0.93 ng/mL; range: 0.38–3.25 ng/mL), were used for the control group, as reported elsewhere.30 This was found to correlate with published in-house PSA data (mean: 0.9312 ng/mL; range: 0.12–3.30 ng/mL) for controls.31
Malignancy Index
The rationale behind the malignancy index resulted from the observation of unusually high PAI-1 values in needle biopsies from patients with BPH, analogous to false-positive PSA values. Controversy surrounding PSA, and no level of evidence existing for PAI-1 and uPA, other than in node-negative breast cancer,11 prompted the integration of the three biomarkers and age in a malignancy index (in units of mal: 1 mal=1 ng3´[mg protein]–2´ml–1´y–1), as defined, below:20
Malignancy index=([PSA]x[uPA]x[PAI–1])/age
STATISTICAL ANALYSIS
Statistical analyses were performed using GraphPad Prism scientific graphing and statistics software (GraphPad Software, San Diego, California, USA). To compare the data sets, the unpaired t-test was used, and p-values were calculated from two-sided tests. A value of <0.05 indicated a statistically significant difference between the data sets.
RESULTS
The age distribution of the participants is presented in Table 1. For the plasma group, disease progression appeared to be correlated with age, with elderly patients presenting with advanced disease. The control cohort of this group was significantly younger than patients of all stages (p<0.0001), possibly because the majority (approximately 76%) of the former were aged ≤60 years. In the biopsy group, elderly patients also tended to present with advanced disease (with p-values decreasing from 0.7906 to 0.0089). No relationship was apparent between age and disease stage in the TURP group.
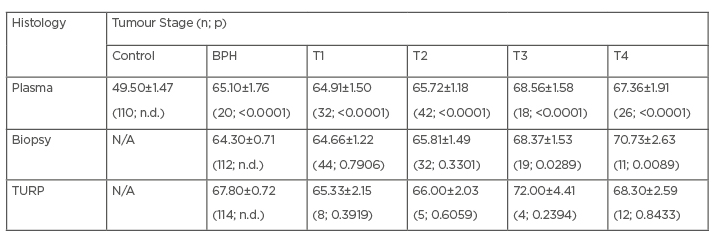
Table 1: Age distribution among the studied participants.
Comparison with the respective controls (control group for plasma; BPH for biopsy and TURP) and the number of participants. Some of the p-values were not determined as group was used as a comparator.
BPH: benign prostatic hyperplasia; N/A: not applicable; n.d.: not determined; TURP: transurethral resection tissue.
Figure 1 shows the comparison of malignancy indices in units of mal (ng3´[mg protein]–2´ml–1´y–1) in plasma samples from the controls, males diagnosed with BPH, and those in various stages of PCa. The malignancy index significantly separates the BPH group from the control group, with a value of 0.0016 (p=0.0346). Plasma samples from stage T1 notwithstanding (p=0.2544), stages T2 through T4 are seen to be significantly different to the control group (n=110), with values of 0.0200 (n=42; p=0.0003), 0.0927 (n=18; p<0.0001), and 0.1920 (n=26; p<0.0001), respectively. The malignancy index is seen to rise with tumour stage.
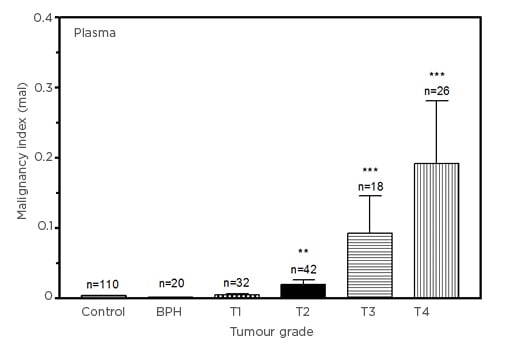
Figure 1: Comparison of malignancy indices (in units of mal: 1 mal=1 ng3[mg protein]–2ml–1y–1) in control, benign prostatic hyperplasia, and Stage T1–T4 prostate cancer plasma samples.
Plasma data (mean±SEM), compared with the control group for statistical significance.
BPH: benign prostatic hyperplasia; SEM: standard error of mean.
Figure 2 shows the comparison of malignancy indices in biopsy tissue from patients diagnosed with BPH and PCa. The malignancy indices increase with tumour stage, from 0.2003±0.0903 (T1) to 26.08±15.56 (T4). Interestingly, the index for the patients with BPH using biopsies was lower than for patients with T1 PCa. This appears to be consistent with the finding that the index is higher in the healthy donors than in patients with BPH for the plasma analysis (Figure 1). While the differences between malignancy indices of T1 (p=0.2439) and T2 (p=0.1466) PCa and the BPH group did not reach statistical significance, those for patients with T3 (p=0.0007) and T4 (p<0.0001) PCa were significant. The large errors in the PCa groups are associated with outlier marker values.
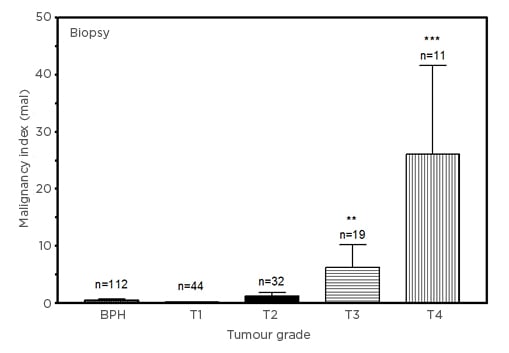
Figure 2: Comparison of malignancy indices (in units of mal: 1 mal=1 ng3[mg protein]–2ml–1y–1) in benign prostatic hyperplasia and Stage T1–T4 prostate cancer biopsy samples.
Biopsy data (mean±SEM), compared with BPH group for statistical significance.
BPH: benign prostatic hyperplasia; SEM: standard error of mean.
Given the small PCa samples across tumour stages for TURP, the malignancy indices are, nevertheless, seen to rise with tumour stage, from 0.0255±0.0115 (T1) to 8.302±3.423 (T4 [hl]Figure 3[/hl]). Relative to the BPH group, the increases in the indices of patients with T2, T3, and T4 PCa were statistically significant (p<0.0001). As in the case of the biopsy experiment (Figure 2), the index for the patients with BPH emerged lower than for patients with T1 PCa (p=0.2062).
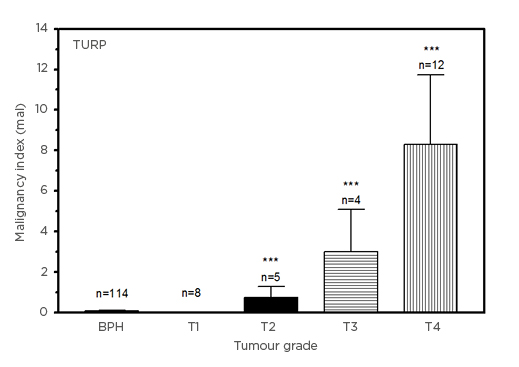
Figure 3: Comparison of malignancy indices (in units of mal: 1 mal=1 ng3[mg protein]–2ml–1y–1) in benign prostatic hyperplasia and Stage T1–T4 prostate cancer transurethral resection tissue samples.
TURP data (mean±SEM), compared with BPH group for statistical significance.
BPH: benign prostatic hyperplasia; SEM: standard error of mean; TURP: transurethral resection tissue.
DISCUSSION
PCa staging is important for evaluating the prognosis of the disease after determining its severity, and guiding patient treatment.32 Staging can be either clinical or pathological. The former uses data when the patient is diagnosed to estimate the extent of the disease. The latter, more accurate method, involves the pathological examination of tissue after surgery to assess the extent of the disease.33 However, staging continues to present challenges to clinicians as not every patient will present with abnormal results in all tests. Radiological imaging such as MRI has contributed immensely to the staging of PCa in primary and post-treatment settings.34,35 Another is the prostate specific membrane antigen (PSMA) PET–CT scan, in which high-affinity gallium-68-labelled and fluorine-18-labelled ligands bind to PSMA, an antigen expressed in prostate cancer and metastases.36 PSMA PET–CT scans cost anything from 20,000 Indian Rupees to 35,000 Indian Rupees (Bookmyscans, Bangalore, India), which is outside the medical budget allocation of poorly resourced countries, as are many of the imaging tests.37
Whither, then, biochemical markers? PCa is a heterogeneous disease, and finding one marker capable of replacing the several examinations currently employed to stage prostate cancer patients is wishful thinking.38 Nonetheless, the search continues for markers capable of predicting a patient’s stage and response to treatment.
Increased angiogenesis is a feature of cancer metastasis and a prime target for treatment since vascularisation leads to tumour growth and invasion. Tumour-associated angiogenesis is directed by particular cytokines, such as IL-6 and TGF-β1.39 IL-6 is also an agent of chronic inflammation in PCa and is reported to play a key role in castration-resistant PCa.40
In a breast cancer study by Ravishankaran and Karunanithi,41 serum IL-6 levels were seen to increase appreciably with tumour stage. Alchalabi et al.42 showed a strong association between IL-6 levels of 70.5, 92.0, 155.7 and 237.5 pg/mL and tumour stage T1 through T4, respectively, in bladder cancer. Mroczko et al.43 showed increased IL-6 levels in line with tumour stage, which was statistically significant in a pancreatic cancer study. In a gastric cancer study by Lukaszewicz-Zajac et al.,44 serum IL-6 levels also increased in line with tumour stage but the differences were not deemed statistically significant.
A study on gastric cancer by Tüzün et al.45 showed that TGF-β1 levels were seen to be significantly higher in stages T2, T3, and T4 but not in stage T1 or the controls.Shim et al.,46 in a colorectal cancer study, showed a significant increase in TGF-β1 levels across all four tumour stages, of 31, 40, 46, and 54 ng/mL, respectively.In a differentiated thyroid cancer study by Zivancevic–Simonovic et al.,47 no significant differences in serum TGF-β1 levels between the patients with differentiated thyroid cancer and the controls was noted. Some studies have shown an increase, then, in serum TGF-β1 levels in different cancers, and others a decrease.48,49
What, then, of IL-6 and TGF-β1 levels in prostate cancer? Wolff et al.50 found that TGF-β1 levels did not discriminate PCa from BPH, and that it did not increase with advancing tumour stage. An earlier study by Perry et al.51 found that TGF–β1 levels did not discriminate the PCa group from the control group and that there was no correlation with either PSA value or tumour stage.In subsequent studies by Shariat et al.,52,53 increased TGF-β1 levels in PCa tissue samples, post-prostatectomy, were shown to be indicators of heightened disease grade and stage.
Kattan et al.54 proposed adding both IL-6 and TGF-β1 to the existing arsenal of clinical markers, which improved their ability to predict the biochemical progression of PCa.
In this study, using transurethral and biopsy tissue and plasma samples, the robustness of a malignancy index that not only discriminates PCa from non–PCa but is also able to predict tumour stage is also examined. This preliminary research shows that the malignancy index increases with disease stage (T1 through T4) across three independent prostate sample types, albeit with the limitation of not being matched, and deserves some attention as a credible marker. Given that the malignancy index incorporates three markers, the large error margins noted are associated with occasional outliers, or steep PSA and PAI-1 values. A potential source of bias could be the significant disparity in sample sizes between control group for plasma (or BPH groups for biopsy and TURP) and disease stage (Table 1). Of specific note are those for TURP, where tumour stages numbers as low as 4–12 are compared with a BPH group of 114. Such unmatched sample sizes can skew the statistics in favour of the larger group. Also, the control group of healthy donors for the plasma analysis were much younger than their BPH and PCa counterparts and could inherently exhibit lower marker levels, and thus low malignancy indices.
Another limitation and potential confounder of this study is the inevitable use of BPH groups as controls for the biopsy and TURP analyses. Use of true controls from healthy donors, although invasive and unethical, could lead to different and possibly stronger conclusions. Interestingly, malignancy indices were negligible (data not shown) in prostate biopsy samples derived from patients with pathologies other than PCa or BPH (i.e., atrophic prostate, inflammation, chronic prostatitis, hyperplasia of the bladder). As these non–PCa or non–BPH pathologies could potentially be confounders in the selectivity of any diagnostic tool for PCa, the observation that their malignancy indices are miniscule further emphasises the robustness and discriminatory power of this novel biomarker.