
Abstract
Objectives: To study the link between frailty and cellular senescence, the authors examined the association of leukocyte telomere length (LTL) with a recently introduced measure of subclinical frailty that is based entirely on laboratory test biomarkers (FI-LAB).
Methods: This study was conducted on a random sample of 1,890 Americans aged ≥60 years. Multiple linear regression was used to examine the relationship between FI-LAB and LTL. Secondary analyses were performed to identify the individual biomarkers driving the association between FI-LAB and LTL.
Results: A statistically significant association was found between FI-LAB and LTL after adjusting for multiple covariates, indicating that higher FI-LAB scores are associated with shorter telomeres. Secondary analyses revealed that this association is driven largely by a small number of FI-LAB biomarkers independently linked with telomere shortening.
Conclusion: The study results established a link between subclinical frailty (FI-LAB) and cellular ageing, which may help elucidate the pathophysiological mechanisms that give rise to frailty.
INTRODUCTION
The physiological mechanisms underlying the link between telomere shortening and ageing-related health conditions have not been completely elucidated. To this end, studies have attempted to examine the association between telomere length and ageing-related parameters. One parameter that has received considerable attention is frailty, a clinical construct characterising and quantifying the cumulative burden of ageing-related health deficits. Frailty is a physical state that represents the constellation of health deficits that arise due to gradual loss of the body’s ability to recover from exposure to biological stressors.1 With no existing gold standard, the commonly used operational measures of frailty are the frailty phenotype (FP) and the frailty index (FI). These measures are typically constructed by tallying clinical symptoms of ageing (e.g., disease, disabilities, and functional impairments), with higher scores indicating a higher frequency of age-related health conditions.2 So far, studies examining the relationship between telomere length and clinical frailty measures have found no association,3-10 leaving open the question of how cellular senescence (of which telomere length is an indicator) leads to the clinical deficits seen among frail individuals.
Recently, Howlett et al.11 introduced a new frailty measure that is derived solely from laboratory test and blood pressure abnormalities. This index (a lab-based FI named ‘FI-LAB’) is constructed by computing the proportion of laboratory test biomarkers and physiological parameters for which an individual falls outside of the clinical reference range. FI-LAB focusses on subclinical (biological and physiological) rather than clinical deficits, such as disabilities and functional impairments. It also has the benefit of being less subjective than FI and FP, which rely heavily on self-reporting.12 Studies have shown FI-LAB correlates well with clinical frailty measures and demonstrates strong predictive accuracy for mortality, frequency of hospital visits, polypharmacy, and self-assessed health status.11-14 A commonly observed finding in these studies is that, in predictive models containing both FI-LAB and clinical FI, both frailty measures showed significant association with ageing endpoints, suggesting they provide independent information about frailty. Due to its focus on subclinical and preclinical deficits, FI-LAB provides additional information beyond what the more commonly used clinical frailty measures offer.
In this article, the authors examine the association of the novel frailty measure FI-LAB with leukocyte telomere length (LTL) among a randomly selected sample of the USA general population aged ≥60 years. Furthermore, they shed light on the relationship between FI-LAB and LTL by identifying the individual biomarkers driving the observed association. For comparison, investigation of the association of LTL with the most common operationally used clinical measures FP and FI is included.
METHODS
Study Sample
The National Health and Nutrition Examination Survey (NHANES) is an annual survey evaluating the health status of the USA population.15 In this study, the authors restricted their focus to data collected in the 1999–2000 and 2001– 2002 NHANES cycles, as these are the only NHANES cycles in which telomere length was measured. In these cycles, there was a total of 3,706 subjects aged ≥60 years. Subjects with missing values on telomere length measurements, covariates, or variables required for calculation of the frailty indices were excluded. This left a sample of 1,890 subjects.
Leukocyte Telomere Length
A telomere length assay was performed for NHANES 1999–2002 participants aged ≥20 years who had blood collected for DNA purification. Quantitative PCR was used to measure telomere length. To reduce measurement error, each sample was assayed three times on three different days, and telomere length measurements were standardised by dividing by standard reference DNA values (T:S ratio). The mean and standard deviation of the T:S ratios across the three measurements were computed for each sample. The full details of this procedure have been described previously.16
Measures of Frailty
Frailty Phenotype
FP, developed by Fried et al.,17 is based on an approach that considers frailty as a syndrome, the severity of which can be quantified by counting the presence of five key symptoms: unintentional weight loss, weakness (low grip strength), lack of endurance (exhaustion), slow gait speed, and low physical activity (relative to one’s peers). The resulting measure (a simple count ranging from 0–5) is widely known as the FP. Since not all the items comprising FP were measured in NHANES, this study used a modified version of the FP introduced by Wilhelm-Leen et al.18 and used in multiple studies.18-21
Frailty Index
FI is based on an approach that conceptualises frailty as the accumulation of functional and health deficits resulting from a diminishing ability to maintain homeostasis.22 Under this deficit accumulation model, frailty is measured by computing the proportion of deficits present in an individual out of several potential deficits spanning multiple domains of health: disability, functional impairment, and disease.23 The original version of FI, introduced by Rockwood et al.,23 was constructed from 70 clinical deficits. Recently, a 46-item variant of the FI was created for the NHANES based on data available from participants.24 In this study, the authors used a modified version of this FI (Table 1).
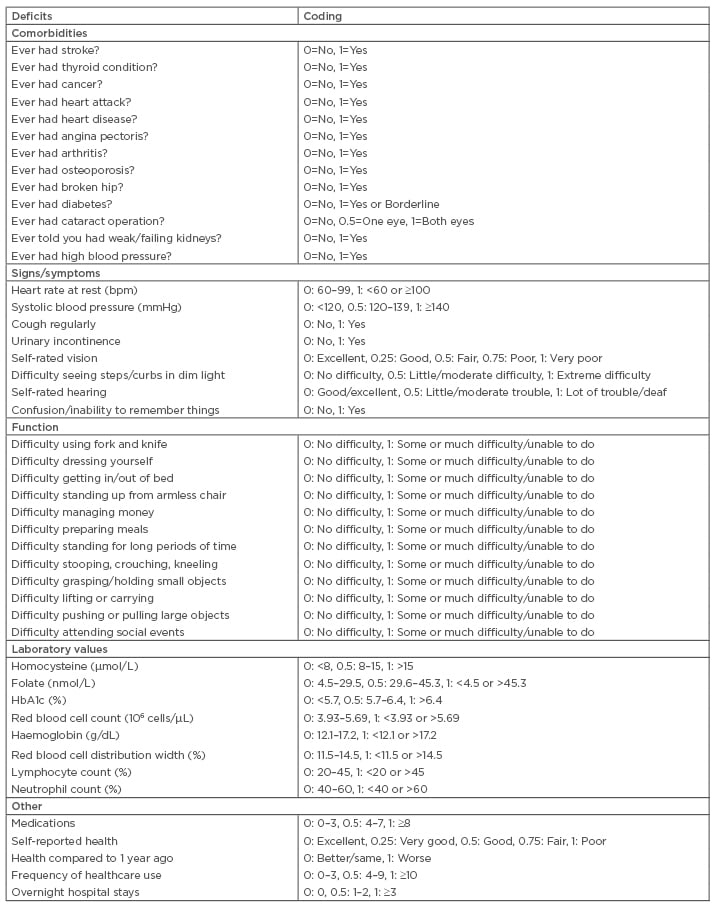
Table 1: Computation of frailty index.
Lab-Based Frailty Index
As discussed, the novel frailty measure FI-LAB focusses on subclinical and preclinical deficits as determined by standard laboratory tests and biomarkers and physiological parameters (e.g., cholesterol, creatinine, and glucose levels). FI-LAB is based on the same deficit accumulation model that underlies the FI but focusses entirely on subclinical deficits (i.e., abnormalities on standard laboratory biomarkers or physiological parameters). FI-LAB is computed as the proportion of biomarkers and physiological parameters for which an individual falls outside of the clinical reference range, as proposed in a recent study by Howlett et al.11 Only 21 out of 23 biomarkers and physiological parameters used in the study were available in the NHANES 1999–2002 database.11 Therefore, the present study used 21 biomarkers to calculate each individual’s FI-LAB score. These biomarkers include albumin, aspartate aminotransferase, systolic blood pressure, diastolic blood pressure, calcium, creatinine, glycohaemoglobin, haemoglobin, mean corpuscular volume (MCV), alkaline phosphatase, phosphate, potassium, protein, sodium, urea nitrogen (serum), white blood cell count, folate, red blood cell folate, thyroid-stimulating hormone, thyroxine, and vitamin B12.
See Table 2 for details of the reference ranges for each biomarker.
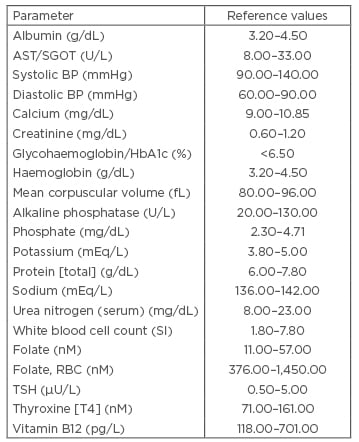
Table 2: Computation of FI-LAB.*
*The original study introducing the lab-based frailty index FI-LAB (Howlett et al.11) used 23 biomarkers, but only 21 of these were available in NHANES 1999–2002 (these 21 biomarkers are listed above). The two missing biomarkers were free thyroxine (T4) and syphilis antibody levels.
AST: aspartate aminotransferase; BP: blood pressure, NHANES: National Health and Nutrition Examination Survey; RBC: red blood cell; SGOT: serum glutamic-oxaloacetic transaminase; TSH: thyroid-stimulating hormone.
Covariates
Analyses were adjusted for age, sex, race and ethnicity, socioeconomic status, education, and tobacco exposure. Age, sex, race, and educational attainment were determined from survey questionnaire responses. Poverty:income ratio (annual family income to the poverty threshold) was used as an indicator of socioeconomic status. Levels of cotinine, a stable metabolite of nicotine, were used as a proxy for tobacco exposure.15
Statistical Analysis
To examine the association of the three frailty measures with LTL, multiple linear regression (MLR) was used. LTL (expressed as mean T:S ratio) was natural log-transformed and treated as the dependent variable in each model, with a frailty measure as an explanatory or independent variable.
Two MLR models were fit for FI, one in which FI was treated as a continuous measure, as recommended by its formulators,24 and one treating it as a categorical variable. In the latter model, FI categories were defined according to the frailty classifications:25 FI≤0.10 (non-frail), 0.10<FI≤0.21 (vulnerable), 0.21<FI≤0.45 (frail), and FI>0.45 (most frail). In both FI models, LTL was treated as the outcome/dependent variable, while FI was treated as the explanatory/independent variable. Two MLR models were fit for FP, one in which FP was treated as continuous (i.e., symptom count ranging from 0–5) and another treating FP as categorical (FP=0 [non-frail], FP=1 or 2 [pre-frail], FP=3, 4, or 5 [frail]). An MLR model was fitted to examine the association between FI-LAB and LTL, in which FI-LAB was treated as a continuous variable.
In secondary analyses, the authors evaluated the LTL to FI-LAB association to identify individual FI-LAB biomarkers statistically correlated with telomere length. For each of the 21 biomarkers comprising the FI-LAB, a covariate-adjusted MLR model was used with LTL as the dependent variable and the biomarker (dichotomised version) as the independent variable. The dichotomised version of each biomarker was derived by assigning a value of 0 to subjects falling within normal ranges (as defined in Table 2) and a value of 1 for subjects with abnormal values of the biomarker (note that, for each subject, summing these binary values across all biomarkers yields the subject’s FI-LAB).
All the above models were adjusted for age, sex, race, and ethnicity (white, black, Hispanic, and other), education (educated to less than high school level, and educated to high school level or above), poverty:income ratio (treated as continuous), and serum cotinine levels (natural log-transformed). All statistical analyses were carried out using R statistical software (version 3.4.0, Vienna, Austria).26
RESULTS
The mean age of the analytic sample (n=1,890) was 70.8 years (standard deviation: 7.7 years). This sample was 48% female and the breakdown of race and ethnicity was 62% white, 14% black, and 22% Hispanic. In the sample, 61% of participants were educated to high school level or above, and the median poverty:income ratio was 2.4.
For FI-LAB, the mean score was 0.24, with a range of 0.05–0.63. The mean FI score was 0.21, with an observed range of 0.01–0.78. For FP, ~61% subjects in the analytic sample had a score of 0 (non-frail). Approximately one-third of subjects had scores in the 1–2 range (pre-frail), and only ~6% had scores of ≥3 (frail). The mean T:S ratio in the analytic sample was 0.9. To transform the unitless T:S ratio to base pair units, the formula (3274+2413[T/S])16 was used, giving ~5,446 base pairs as mean LTL in this sample.
The relationship between FP and FI in the analytic sample was also summarised. In line with what has been previously reported,24 FP and FI showed good correlation (Spearman ρ=0.56 [p<0.0001]). For FL and FP, the Spearman ρ=0.14 (p<0.0001). For FI and FL, Spearman ρ=0.253 (p<0.0001).
MLR models fit to examine the association between each frailty measure and telomere length are summarised in Table 3, which provides coefficient estimates (and standard errors) and p values. Each coefficient estimate represents the (covariate-adjusted) effect of a frailty measure on LTL. Neither FP nor FI showed significant associations with LTL; however, FI-LAB demonstrated a significant association with telomere length (p=0.0056). A 0.1 increase in FI-LAB leads to a 0.015 decrease in the mean T:S ratio which translates to a ~36 base pair reduction in the expected value of LTL.
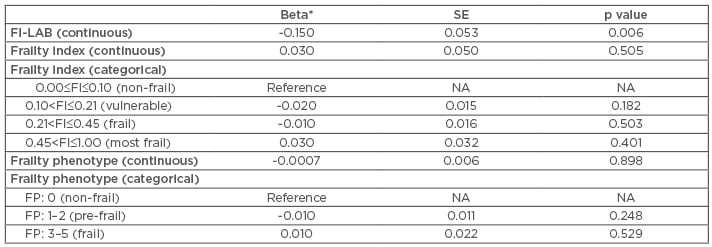
Table 3: Covariate-adjusted coefficient estimates for frailty measures.
For categorical versions of frailty index and frailty phenotype, the ‘non-frail’ category was selected as the baseline or reference level.
*Maximum likelihood estimate of coefficient corresponding to frailty variable.
NA: not applicable; SE: standard error of beta coefficient estimate.
Table 4 summarises covariate effects for the FI-LAB/LTL model. Of note, covariates that were statistically significantly associated with LTL include age, sex, and poverty:income ratio. Age showed an expected inverse relationship with LTL, and female sex was significantly positively associated with higher telomere length, in line with several prior studies.27 Poverty:income ratio also showed a significant positive association with LTL, suggesting that, after controlling for other potential confounders, a higher income is associated with longer LTL. This is supported by multiple reports highlighting the role of socioeconomic status as a primary psychosocial factor linked with telomere shortening.28-30
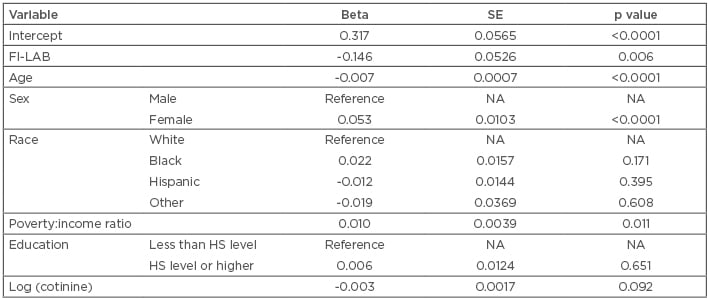
Table 4: Linear regression examining the association between leukocyte telomere length (expressed as mean T:S ratio) and FI-LAB, adjusting for demographic and lifestyle-related covariates.
HS: high school; NA: not applicable SE: standard error of beta coefficient estimate.
As detailed in the methods section, secondary analyses were performed to examine the association of each individual (dichotomised) FI-LAB component with LTL, adjusting for covariates such as age, sex, race and ethnicity, and poverty:income ratio. Of the 21 lab tests and physiological parameters comprising the FI-LAB, only 4 showed a statistically significant association with LTL: serum albumin (beta=-0.025; p=0.0280), total protein (beta=-0.040; p=0.0009), MCV (beta=-0.058; p<0.0001), and aspartate aminotransferase (beta=-0.042; p=0.0120). The authors recalculated the FI-LAB excluding these four lab tests and found that the new index showed no association with LTL (p=0.6). This implies that these four parameters may be largely responsible for the observed association between FI-LAB and LTL.
DISCUSSION
Both telomere length and frailty have been shown to be determinants of ageing-related health endpoints and mortality in previous studies. However, a definitive association between these two correlates of ageing has not been established. In this study, the authors re-examined this question using a novel laboratory measure-based index of frailty (FI-LAB) that focusses on subclinical deficits, in contrast to previously commonly used frailty measures (FI and FP), which are largely based on clinical deficits.3-8 In this study, the authors found a significant association between increased FI-LAB and decreased LTL. Another novel aspect of the study is that it is, to the authors’ knowledge, the first to investigate the individual biomarkers driving the observed association between FI-LAB and LTL.
FI-LAB was recently introduced by Howlett et al.11 as an alternative to commonly used operational frailty metrics. It focusses on subclinical aspects of frailty that the standard clinical frailty measures do not, and studies suggest it may provide independent and additional information regarding the physiological dysregulation preceding mortality.
The key distinction between FI-LAB and clinical FI is that the former is based entirely on biochemical markers and physiological parameters; hence, it is believed to represent the burden of subclinical deficits,14 which can be thought of as systemic, organ-level dysregulation that occurs as a direct result of molecular or cellular level damage (e.g., from oxidative stress or telomere attrition), and in turn leads to macroscopic (clinically evident) functional deficits and impairments. The subclinical dysregulation measured by FI-LAB provides an intermediate link between cellular-level damage that eventually scales up to clinically detectable impairments or deficits.12 The lab test biomarkers used to construct the FI-LAB (e.g., liver function enzymes, kidney function biomarkers, and haematological parameters) directly measure system and organ-level dysregulation, which is a direct by-product of cellular and molecular-level damage and the precursor of clinically detectable deficits. This could be a reason why FI-LAB exhibits a stronger association with telomere length, a key marker of cellular integrity, than FI and FP, which are based on clinical endpoints.
This idea is corroborated by the findings from the secondary analyses, in which the individual biomarkers driving the FI-LAB/LTL association were identified: serum albumin, total serum protein, MCV, and aspartate aminotransferase. Removing these four biomarkers (out of a total of 21) from FI-LAB completely nullifies its association with LTL. An examination of the clinical and epidemiological literature on these biomarkers reveals that most appear to be intimately linked with ageing-related cellular damage processes (specifically inflammation and oxidative stress). For example, serum albumin is a well-known marker of systemic inflammation and is strongly linked with cellular pathology;31,32 it is also directly related to total protein (the sum of albumin and globulin levels in the serum). Synthesised in the liver, albumin is a ubiquitous protein involved in a multitude of physiological functions, many relevant to pathology and dysfunction in cellular processes. It has long been recognised as a strong predictor of mortality in both healthy and hospitalised populations,33,34 and is a strong indicator of preclinical disease.32,35-37
MCV is a measure of the average volume of erythrocytes, which serves as a qualitative measure of erythrocyte health. It has been found to be highly significantly associated with LTL, with an effect size comparable to that of tobacco smoking on telomere length.38,39 The biological link between erythrocyte function and homeostasis and telomere dynamics is well-established.40-42 Also, erythrocyte metabolism is related to antioxidant activity in the extracellular milieu.43 Therefore, erythrocytes have been considered ‘passive’ markers of the status of oxidative stress in the body.44,45
The authors acknowledge a few limitations of this study. LTL was measured at a single timepoint, meaning that telomere attrition rate could not be examined, and single timepoint measurements of telomere length may be limited in their ability to capture the cellular ageing process.46 Secondly, the study was limited to a USA population; therefore, future studies in other geographic areas are warranted to replicate the findings. Another limitation concerns the generalisability of the results on the association between FI-LAB and LTL and the secondary analyses identifying individual FI-LAB biomarkers driving this association. It is possible that the results observed in this study may be specific to the particular version of FI-LAB used. Although this version was introduced in the seminal paper by Howlett et al.11 and has been used in multiple studies, alternative formulations of lab-based frailty indices have also been developed. In general, using the deficit accumulation model of frailty, lab-based frailty indices can be constructed from any set of biomarkers or physiological parameters that meet certain criteria (e.g., variation with age).47 If such a set of biomarkers is sufficiently large and diverse, representing a wide array of physiological systems, a FI constructed from this set should reflect subclinical and preclinical frailty. This implies that, provided the aforementioned criteria are met, frailty indices should be largely insensitive to the particular biomarkers and/or physiological parameters used to construct them.48 As a corollary of this, lab-based frailty indices with very different biomarker compositions should nevertheless be intercorrelated since they are all measuring the same underlying construct of subclinical frailty. Therefore, the authors hypothesised that the results can be generalised to other FI-LAB formulations; however, this was not investigated in the current study.
CONCLUSION
In conclusion, this study has demonstrated that a frailty measure constructed from standard laboratory tests and physiological parameters exhibits a significant association with LTL among a cohort of the USA general population aged ≥60 years. The results also identify individual parameters largely responsible for this association, offering putative insights into the pathways linking physiological dysregulation and telomere shortening.